
Mullaney on the Markets
Onward and upward
By Michael Mullaney | Director of Global Markets Research
Published August 2025
Continued progress on trade negotiations, lower than feared tariff rates, better than expected Q2 earnings and GDP reports, and positive technical indicators led the S&P 500 Index to a gain of 2.24% for July, with the index hitting its 15th record high for the year along the way, including a stretch of six consecutive daily record closes, the best such streak since July 2024. The concentration of returns remained an issue, however, as the S&P 500 Equal-Weighted Index returned just 0.97% for the month.
Bonds did not fair as well, as the Bloomberg U.S. Aggregate Bond Index slipped by 0.26% with rates for Treasury securities with maturities ranging from 2 to 30 years increasing by an average of 17 basis points; the yield of the 2-year Treasury (the Treasury most sensitive to Fed policy decisions) increased by 24 basis points as the probability of a Fed rate cut in September fell from 91% at the beginning of the month to 40% by month end.
Year to date, the S&P 500 gained 8.58% and the Bloomberg U.S. Aggregate Bond Index returned 3.75%.
Big Tech continued to skew market returns
Information Technology led all sectors once again in July and was responsible for 76% of the overall return for the S&P 500 Index when both the sector’s return and index weight (a hefty 33.5%) are taken into consideration. Nvidia’s return alone (up 12.6%) was responsible for 54% of the Tech sector’s performance for the month and 41% of the overall return of the S&P 500.
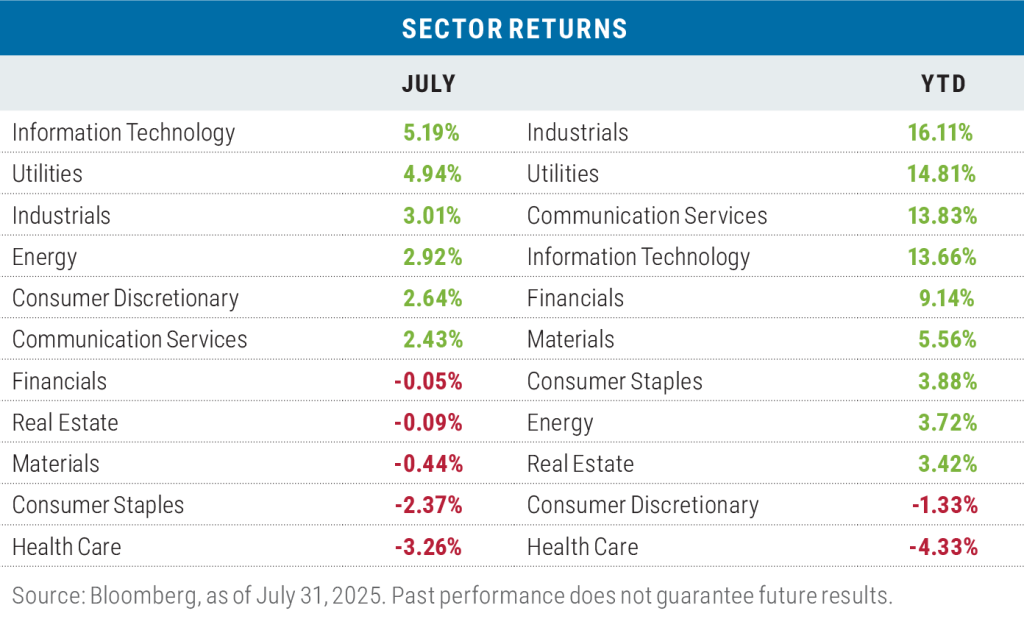
The electricity generation needed to run data centers and continue developed artificial intelligence (AI) applications helped lift the Utilities sector into a second-place finish for the month.
Health Care once again pulled up the rear as uncertainty regarding looming tariffs dragged the sector down. A 20.01% loss by UnitedHealth Group didn’t help matters as the company came under investigation by the U.S. Department of Justice (DOJ) for its Medicare billing practices, specifically focusing on allegations of fraud and upcoding in the Medicare Advantage program. The stock is the fourth largest in the sector.
Year to date, the Industrials sector maintained its lead thanks to favorable tax breaks and the Trump administration’s emphasis on the reshoring U.S. manufacturing.
As was the case in July, Health Care was the laggard on a year-to-date basis as well.
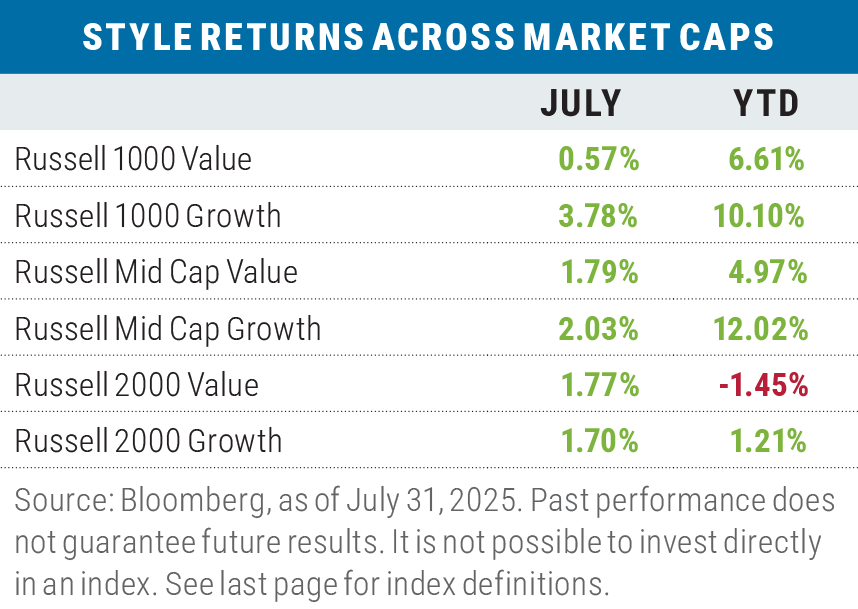
Large-cap growth continued to lead
Growth beat Value in two Russell market capitalization ranges (large and mid-cap) during the month, while in the small-cap space, the Russell 2000 Value Index was able to nudge slightly ahead of the Russell 2000 Growth Index. The biggest relative outperformance was once again in large caps, where the Russell 1000 Growth Index beat its value counterpart by 321 basis points during the month, with 62% of the difference in return coming from of the Russell 1000 Growth’s Information Technology Sector, and 35% from Nvidia alone.
Year to date, growth leads value by 4.40% when averaged across the three capitalization ranges of the respective Russell benchmarks. In large caps, information Technology accounts for 78% of growth’s relative outperformance versus value, and Nvidia alone represents 73% of the return differential. Nvidia represents 10.7% of the Russell 1000 Growth Index and has a 0% weight in the Russell 1000 Value Index.
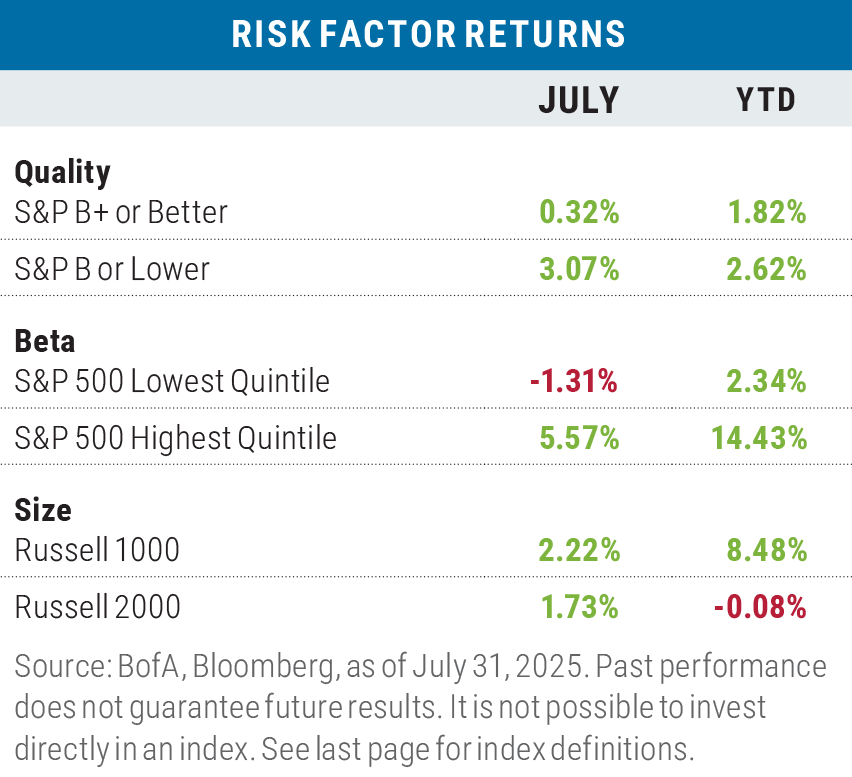
More “risk on” than “risk off” in July
Low-quality and high-beta factors outperformed their counterparts during the month, while small size lagged with the Russell 2000 Index trailing the Russell 1000 Index. Big Tech was once again the dominant relative return factor with a 4.97% return in the Russell 1000 Index, but just a 0.11% gain for tech in the Russell 2000 Index. Year to date, the size factor is the only risk-on segment where the risk-on theme hasn’t outperformed.
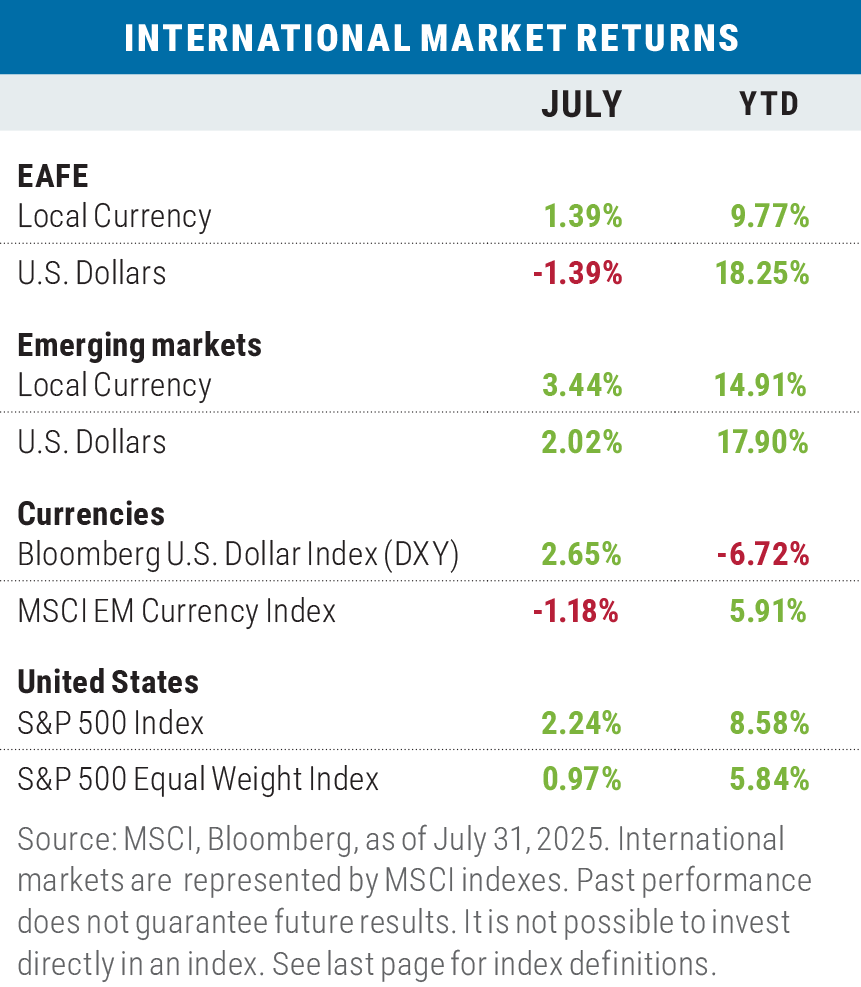
Mixed results for non-U.S. stocks in July
In local currency terms, developed market international stocks lagged the S&P 500 on a cap-weighted basis but exceeded the S&P 500 Equal-Weighted Index; emerging-market stocks, meanwhile, beat both the cap-weighted and equal-weighted S&P 500 benchmarks.
In U.S. dollar (USD) terms, both developed and emerging market stocks lagged the cap-weighted S&P 500 as the dollar had a rare month of gains versus both developed market and emerging market currencies driven in part by rising U.S. interest rates and the Fed’s decision to hold rates steady at the July Federal Open Markets Committee (FOMC) meeting.
Year to date, developed- and emerging-market stocks have outperformed the S&P 500, in both USD and local currency terms as global investors have reallocated away from U.S. stocks.
Looking ahead
The most recent earnings season has generally been kind to investors: Roughly two-thirds of companies in the S&P 500 have reported results, with 82% reporting having a positive EPS surprise averaging 8.3% above consensus estimates. The blended earnings growth rate (actual and expected results) for Q2 2025 is now 10.3% versus an expected 4.9% on June 30. Companies beating on both the top and bottom lines (revenue and earnings, a.k.a. “double beats”) saw their stock prices rise by 1.4% on average versus a 5-year average gain of 0.80%. “Double misses” on the other hand have fallen by 4.9% versus a 5-year average decline of 3.2%.
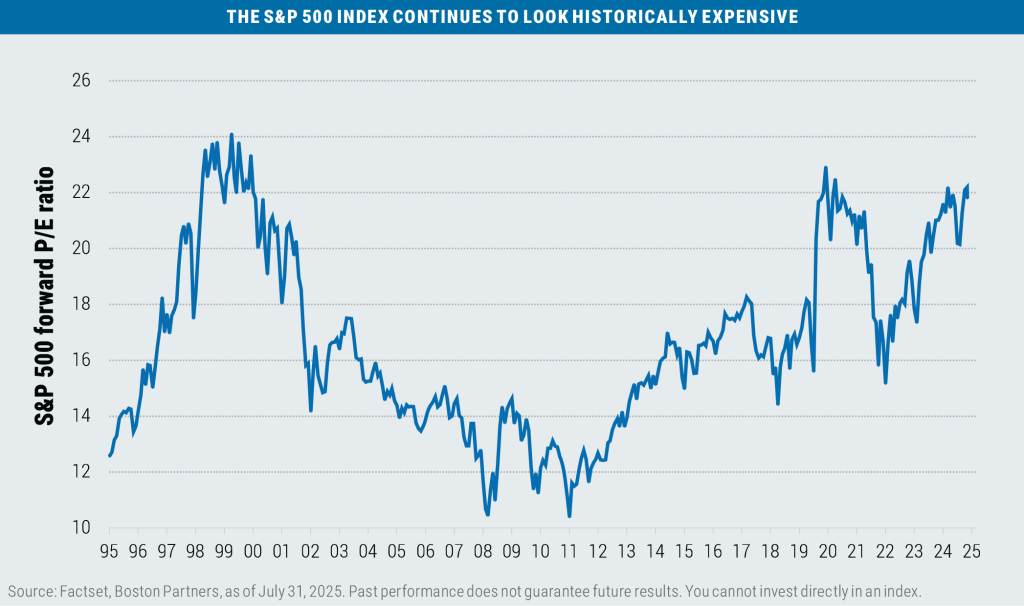
Earnings guidance for Q3 2025 has been mixed, with 27 companies issuing positive guidance and 30 companies issuing negative guidance. All that said, at 21.8 times forward earnings, the valuation of the S&P 500 remains quite elevated versus history, with little wiggle room for disappointment.
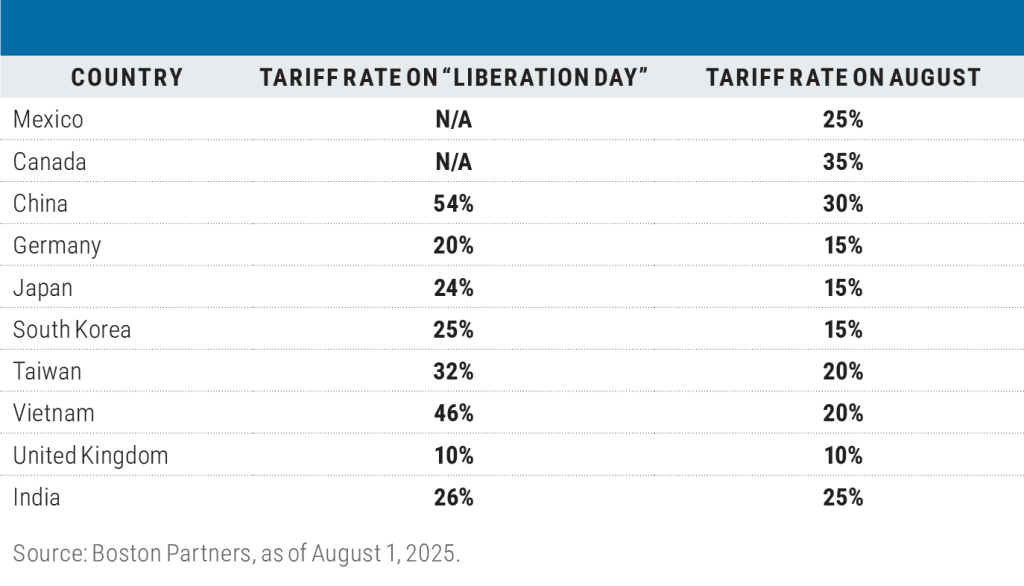
Turning to trade and tariffs, on August 1, the Trump administration unveiled (finally!) the tariff rates for a broad array of the United States’ trading partners to be put in effect on August 7.
The rates for the United States’ top 10 trading partners are as follows, and in almost all cases are lower than the initial rates that were announced on “Liberation Day” in April.
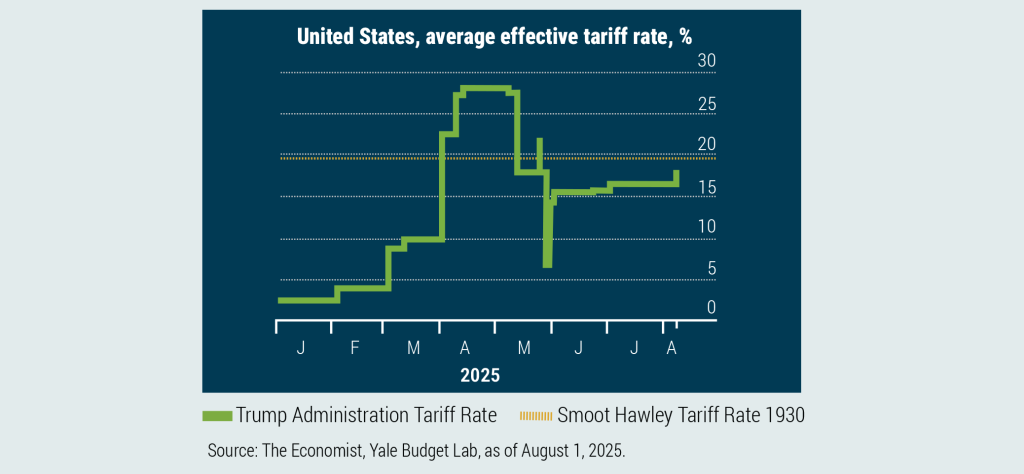
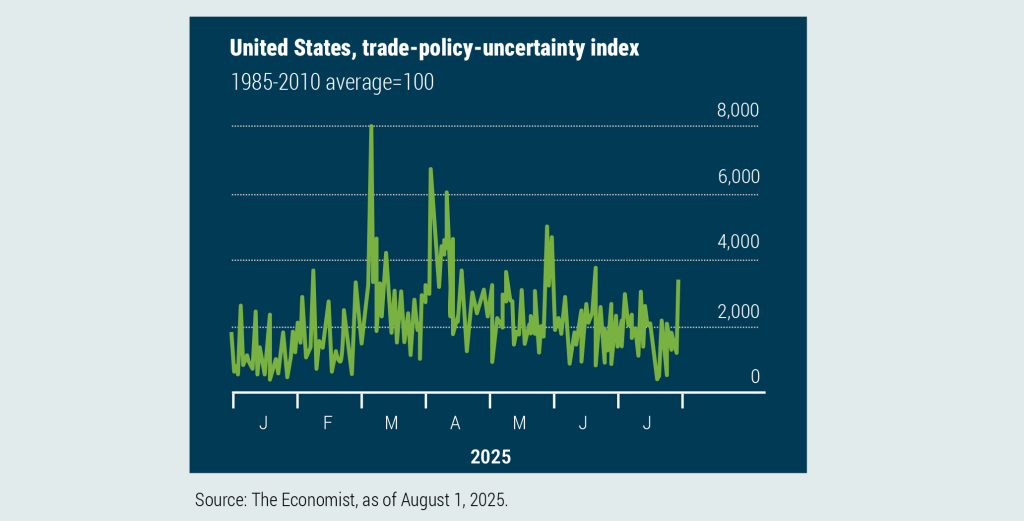
While investors were generally relieved that the tariff rates came in lower than many had feared, the overall effective tariff rate for the United States has still increased from 2.4% to 18%, the highest rate in nearly 100 years. As such, trade policy uncertainty remains elevated—justifiably so.
While the advance report on Q2 GDP came in above consensus expectations, much of the gain is attributable to the drop in imports, which act as a drag on GDP growth and had surged on tariff front-running during Q1.
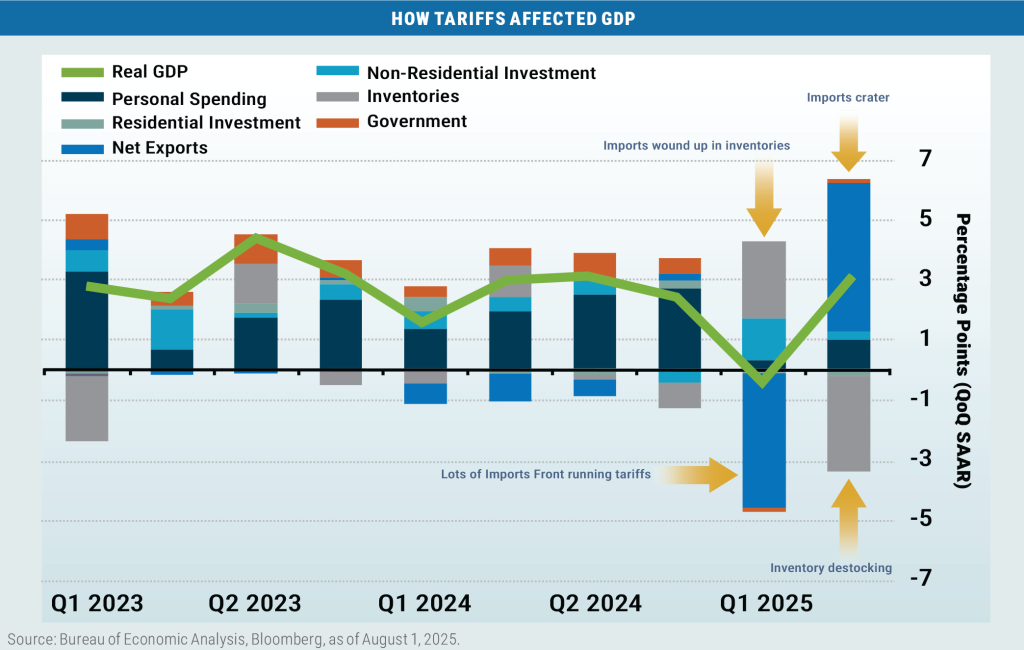
Final sales to private domestic purchasers (a metric that strips out government spending and the impact of trade) paints a more subdued economic picture.
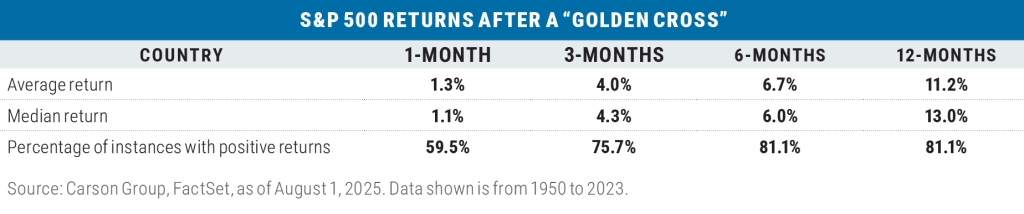
The technical backdrop for the S&P 500 remains positive with the index recording a “Golden Cross” on July 1 when the 50-day moving average of the index crossed above the 200-day moving average—historically, a bullish signal. For the month following a Golden Cross, the markets have generated a positive return a somewhat unremarkable 59.5% of the time dating back to 1928. However, subsequent periods have posted a positive return with a much higher frequency.
The question remains, however, as to how much positive news is already imbedded in stock prices—and according to the CNN Fear & Greed Index, the answer appears to be a fair amount.
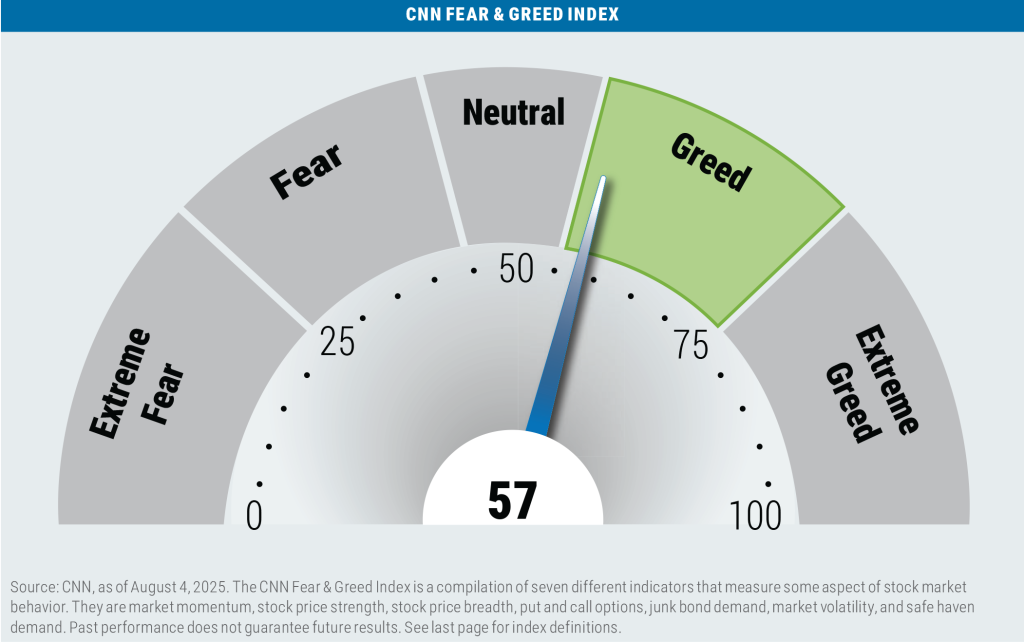
As Mark Twain would say, “Whenever you find yourself on the side of the majority, it is time to pause and reflect”.

Important disclosures
Boston Partners Global Investors, Inc. (Boston Partners) is composed of three divisions, Boston Partners, Boston Partners Private Wealth, and Weiss, Peck & Greer (WPG) Partners, and is an indirect, wholly owned subsidiary of ORIX Corporation of Japan (ORIX).
The views expressed in this commentary reflect those of the author as of the date of this commentary. Any such views are subject to change at any time based on market and other conditions and Boston Partners disclaims any responsibility to update such views. Past performance is not an indication of future results.
Discussions of securities, market returns, and trends are not intended to be a forecast of future events or returns. You should not assume that investments in the securities identified and discussed were or will be profitable.
Terms and definitions
Beta is a measure of a portfolio’s market risk relative to its benchmark. In general, a beta higher than 1.00 indicates a more volatile portfolio and beta lower than 1.00 indicates a less volatile portfolio in relation to its benchmark. The Bloomberg U.S. Aggregate Bond Index tracks the performance of intermediate-term investment-grade bonds traded in the United States. The Bloomberg U.S. Dollar Index (DXY) is used to measure the value of the dollar against a basket of
six foreign currencies. The value of the index is a fair indication of the dollar’s value in global markets. The CNN Fear & Greed Index is a compilation of seven different indicators that measure some aspect of stock market behavior. They are market momentum, stock price strength, stock price breadth, put and call options, junk bond demand, market volatility, and safe haven demand. Earnings per share (EPS) reflects a company’s total earnings, typically over the trailing 12 months, divided by the total number of shares outstanding. The Federal Open Market Committee (FOMC) is a rotating group of 12 members of the Federal Reserve system tasked with setting and implementing monetary policy. Forward P/E is a ratio that compares the current share price of a company to its estimated earnings per share over the next 12 months. Gross domestic product (GDP) is the total value of the goods and services produced within a country and a key measure of economic health. Real GDP accounts for the effects of inflation. The MSCI Emerging Markets (EM) Currency Index tracks the performance of emerging market currencies relative to the U.S. dollar where the weight of each currency is equal to its country weight in the MSCI Emerging Markets Index. The MSCI EAFE Index tracks the performance of large- and mid-cap equities traded across global developed markets, excluding the United States and Canada. The MSCI Emerging Markets Index tracks the performance of large- and mid-cap equities traded in global emerging markets. The Russell 1000 Index tracks the performance of the 1,000 largest companies traded in the United States. The Russell 2000 Index tracks the performance of the 2,000 smallest companies traded in the United States. The Russell 1000 Growth and Value Indexes track the performance of those large-cap U.S. equities in the Russell 1000 Index with growth and value style characteristics, respectively. The Russell 2000 Growth and Value Indexes track the performance of those small-cap U.S. equities in the Russell 2000 Index with growth and value style characteristics, respectively. The Russell Midcap Growth and Value Indexes track the performance of those mid-cap U.S. companies in the Russell 1000 Index with growth and value style characteristics, respectively. The S&P 500 Index tracks the performance of the 500 largest companies traded in the United States. The S&P 500 Equal Weight Index also tracks the performance of the 500 largest companies traded in the United States, but weights each company equally, rather than proportionally according to market cap. S&P credit ratings, which range from AAA (highest) to D (default), are assigned by S&P Global to individual companies to indicate their relative creditworthiness. Seasonally adjusted annual rate (SAAR) is a statistical measure that attempts to normalize recurring seasonal variations in data in order to allow for more accurate comparisons between data points from different times of the year. It is not possible to invest directly in an index.
Market capitalization breakpoints
The breakpoints for capitalization ranges should be viewed only as guideposts and will change over time. In general, FTSE Russell (which maintains a number of stock-market indexes based on company size) considers small-cap stocks to have market caps of between $150 million and $7 billion, mid caps to have market caps between $7 billion and $150 billion, and large caps to be those companies with market caps above $150 billion.
8256236.1