
Mullaney on the Markets
Mixed messages in March
By Michael Mullaney | Director of Global Markets Research
Published April 2026
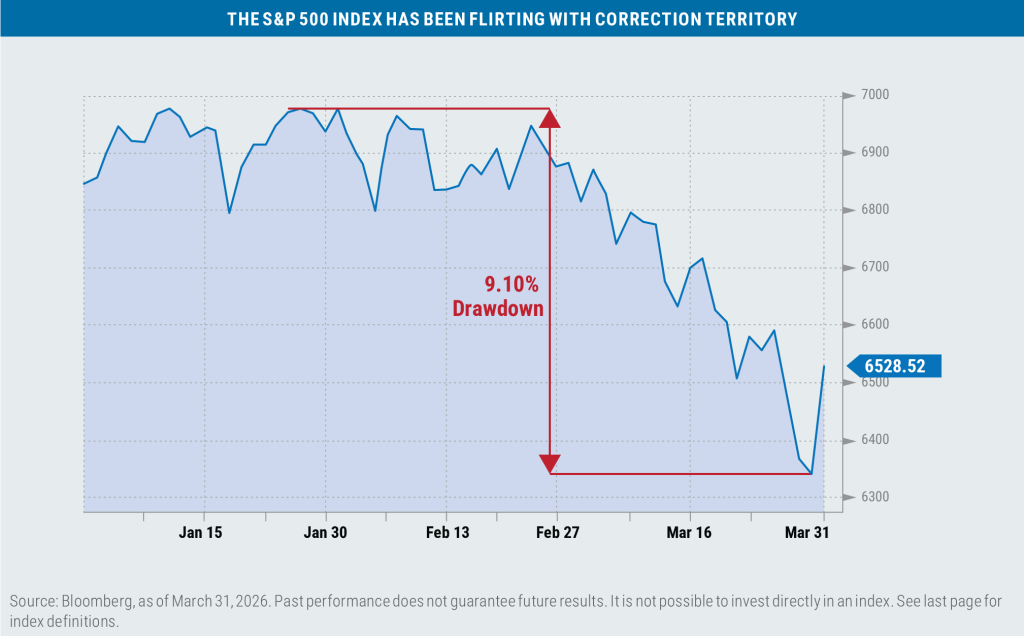
Despite a strong short-covering rally (up 2.92%) on the last day of the month, the S&P 500 Index dropped by 4.98% during March, the benchmark’s worst single-month performance since March of 2025. The prospect of a prolonged and expanded conflict in Iran and across the Middle East rattled investors as oil prices soared on reduced supply. Bonds offered little to no relief as the surge in energy prices led to a subsequent spike in interest rates, stoking inflation fears and leading to a 1.76% loss for the Bloomberg U.S. Aggregate Bond Index.
International markets suffered even more as the MSCI World ex U.S. Index fell by 9.64% and the Bloomberg Global Aggregate Bond Index dropped by 3.07% during the month. Safe havens of any sort were hard to find: The Bloomberg DXY Dollar Index (up 2.36%), Bitcoin (up 3.33%), and T-Bills/cash (up 0.29%) were among the few asset categories with positive returns during the month. It was the first positive monthly return for Bitcoin since last September.
During the first quarter, the S&P 500 fell by 4.35%, the benchmark’s worst quarterly performance since Q3 2022, though the S&P 500 Equal-Weighted Index was able to squeak out a modest gain of 0.65% for the quarter.
The return of the overall U.S. bond market for the quarter depended upon one’s chosen benchmark, as the Bloomberg U.S. Aggregate Index fell by 0.05%, while the ICE BofA U.S. Corporate, Government & Mortgage Index gained 0.05%.
Sector returns in March
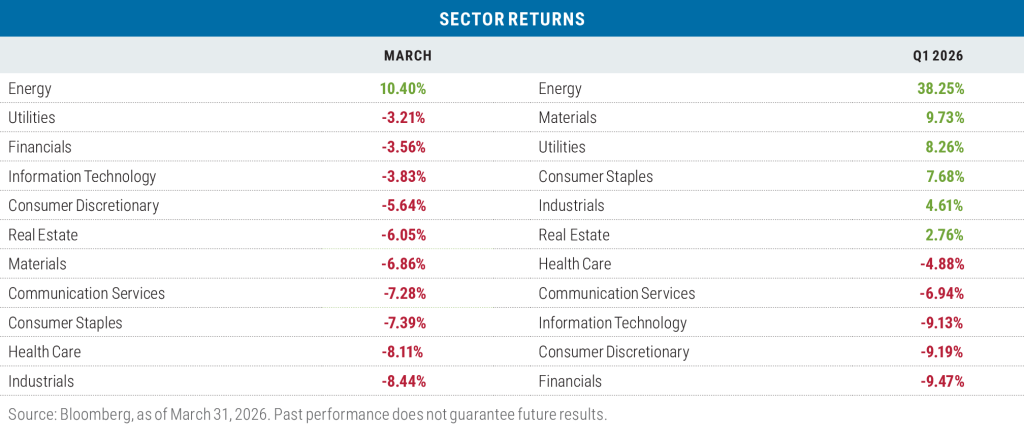
Of the eleven sectors that comprise the S&P 500, only Energy was able to produce a positive return in March, buoyed by the surge in the prices of West Texas Intermediate crude oil (+51.5%), Brent crude oil (+43.8%) and AAA regular unleaded gasoline (+36.3%). It was the best monthly return for the sector since March 2024. The “no place to hide” theme during the month was also evident at the sector level as the traditionally defensive Consumer Staples, Utilities, and Health Care
sectors also experienced losses during March.
The Energy sector also led by a long shot during the quarter; its 38.25% return was the best for the sector since Q1 2022. Five other sectors posted positive returns during the quarter and five produced losses. The three sectors where the Magnificent Seven reside (Communication Services, Information Technology, and Consumer Discretionary) were hard hit during the quarter as the Mag 7 fell by 12.04%. Those seven stocks collectively represent an average of 66% of the three sectors and 32.7% of the overall S&P 500.
Financials pulled up the rear for the quarter, hurt by exposure to asset management companies that specialize in investing in the private credit markets, where significant losses on individual company loans triggered a rush to redeem from private credit funds. Firms that were particularly hard hit included Apollo Global Management (down 22.70%), Blackstone (down 24.55%), and KKR & Company (down 27.31%).
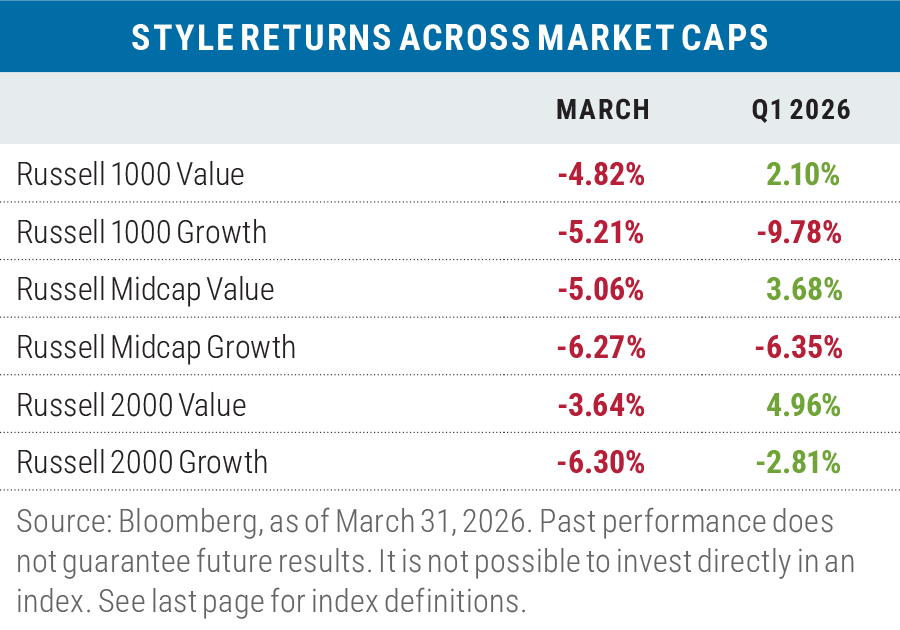
Value outperforms again in March
For a fifth consecutive month value outperformed growth, albeit by losing less in a down month. The outperformance of value was 1.42% on average when measured across the three capitalization ranges of the major Russell benchmarks. This stretch—beginning in November 2025—was the best combined return for value versus growth for five months since May 2022. Among large caps, it was the best five-month performance stretch for the Russell 1000 Value Index versus the Russell 1000 Growth Index on record, going back to 1978.
For the quarter, value beat growth by an average of 9.89% across the three capitalization ranges, with value posting gains versus losses for growth.
Sectors that contributed to the outperformance of value over the quarter varied: In large caps, it was mostly due to the Energy sector, which in the Russell 1000 Value Index carries a 6.33% weight and returned 38.35%. The Energy sector in the Russell 1000 Growth Index did have a 43.64% return for the quarter, but the sector carries a mere 0.37% weight in the index.
In the mid-cap space, it was the Information Technology sector that made the difference, with the Russell Midcap Value Index posting a return of 12.76% for the quarter, while the Russell Midcap Growth Index suffered a loss of 13.00% in the Tech sector.
In small caps, it was a toss-up between Energy and Information Technology that drove the outperformance of the Russell 2000 Value Index versus the Russell 2000 Growth Index.The Energy sector returned 43.37% in the small-cap value index versus 26.06% for the small-cap growth index; the Information Technology sector, meanwhile, posted a return of 9.90% in the Russell 2000 Value Index versus a loss of 9.82% for the same sector in the Russell 2000 Growth Index. Combined, these two sectors accounted for over 63% of the outperformance of the Russell 2000 Value Index for the quarter.
Within Technology, there was a distinct difference in returns between hardware and software companies during the quarter. Within the S&P 500 Information Technology sector, the return was –1.58% collectively for hardware companies, while software companies suffered a 23.71% loss over the period according to GICS Level 2 Index data. Software is thought to be where artificial intelligence applications will inflict the most damage to existing business models.
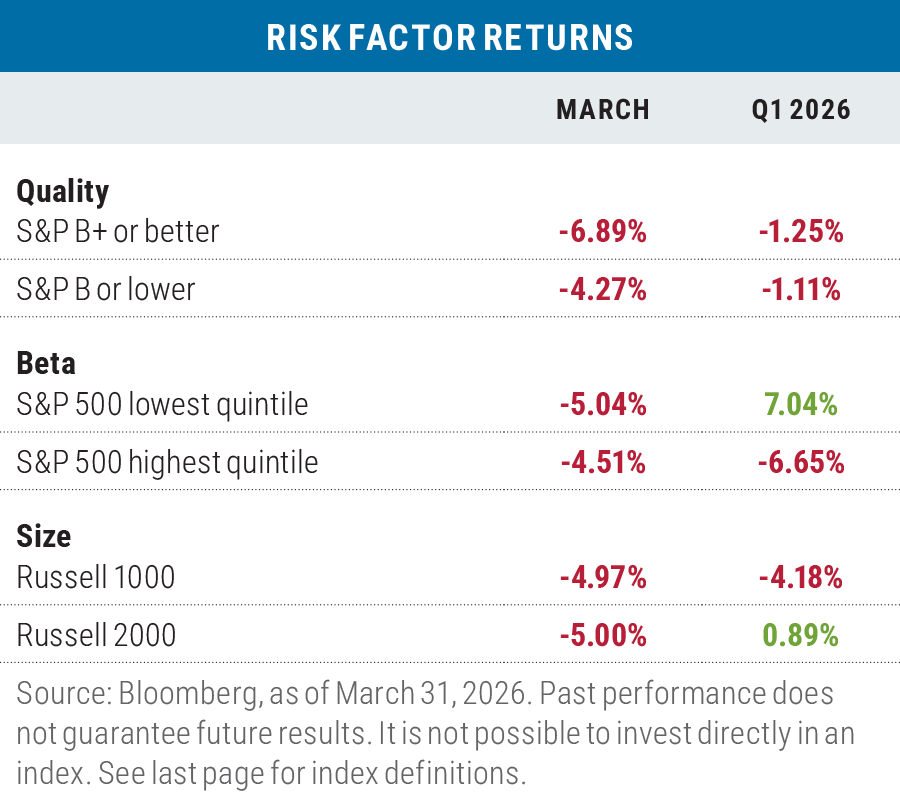
Despite sell off, lower-risk factors were of little help in March
In March the usual “risk off” factors of high quality and low beta didn’t work, hurt by the underperformance of Health Care and Consumer Staples stocks, which have those factor characteristics. Large-size names versus small-size securities was beneficial, but only at the margin.
The quarter also saw mixed results for factor performance as high quality lagged low quality and large size lagged small size. Only low beta was advantageous for performance during the first quarter.
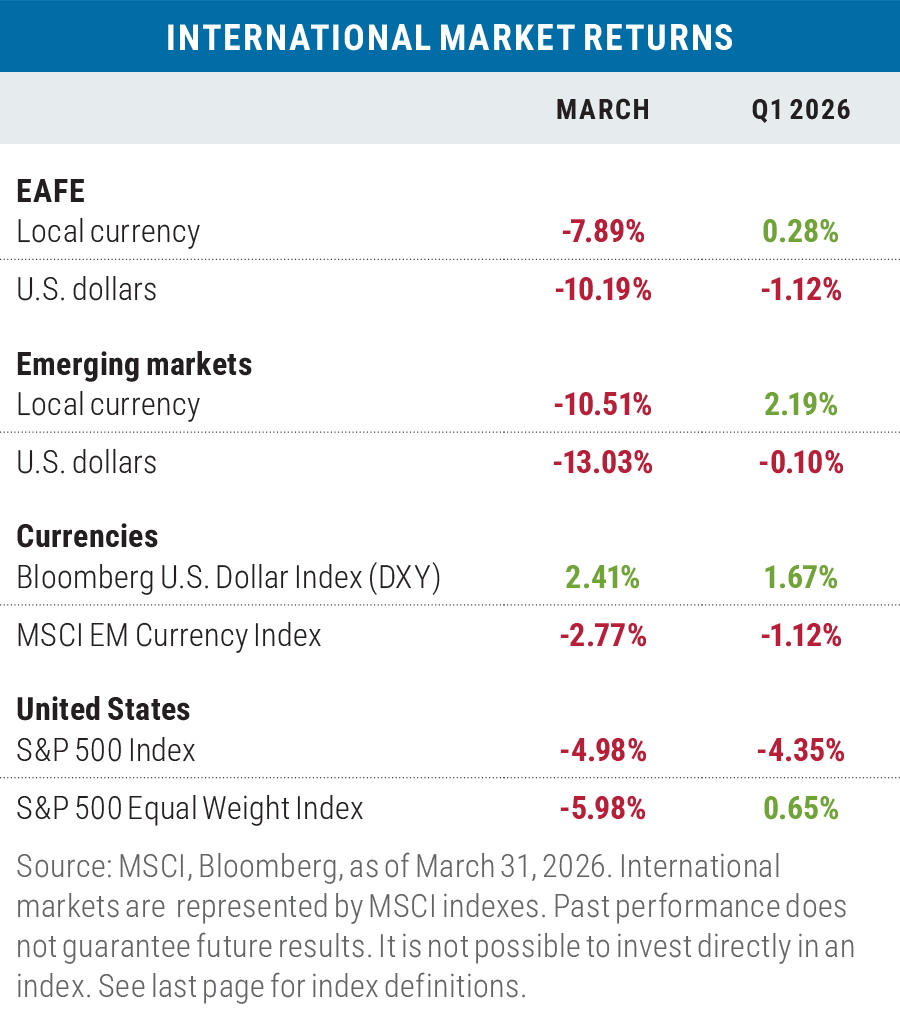
International stocks trailed the S&P 500 in March
Developed market international stocks (as measured by the MSCI EAFE Index) lagged the S&P 500 in March, as the downstream effects of the military conflict in Iran were more pronounced for countries outside the United States. That was also especially true for emerging market stocks, which tend to be highly sensitive to changes in energy prices. Results for international stocks in dollar terms was even worse, given the strength of the dollar during the month.
For the quarter, both developed- and emerging-market stocks were able to maintain gains in local currency terms given their positive performance in both January and February, though both saw negative returns in dollar terms.
Looking ahead
The conflict with Iran that began on February 28 originally had appeared likely to be a short-lived, targeted operation, but has now entered its second month.
Since the beginning, there have been mixed messages from the administration as to the rationale for, the strategy behind, and ultimately the objective of the operation. The rationale has vacillated between insuring a regime change, the destruction of Iran’s missile and drone manufacturing sites, and/or the elimination of Iran’s nuclear capabilities.
At the onset of the conflict, there was an indication that it would last as little as three weeks, given that military operations to eliminate the country’s leadership, destroy its missile, drone, and air defense systems, and cripple its naval capabilities were accomplished ahead of schedule.
As of this writing, President Trump has indicated that the conflict will go on for “another two to three weeks” as the Iranians have moved to a decentralized command structure and continue to have control of vessel flow through the Strait of Hormuz, through which 20% of the world’s oil supply passes.
Whether ground troops will be deployed in the region to “Free the Straight” or the mission escalates to involve destroying Iran’s power grid and desalinization plants remains an open question. Negotiations to end the war remain vague at best.
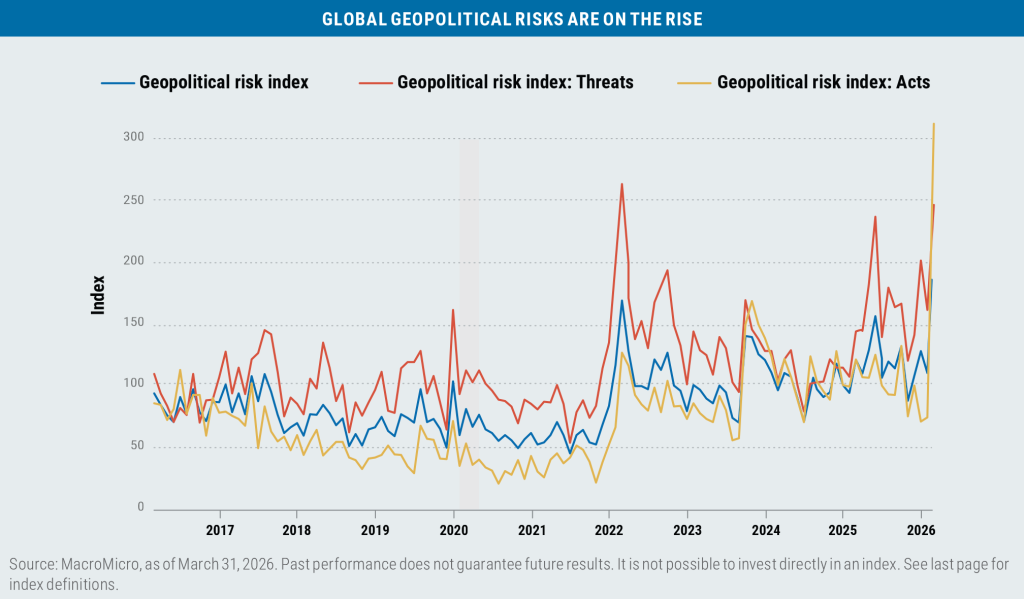
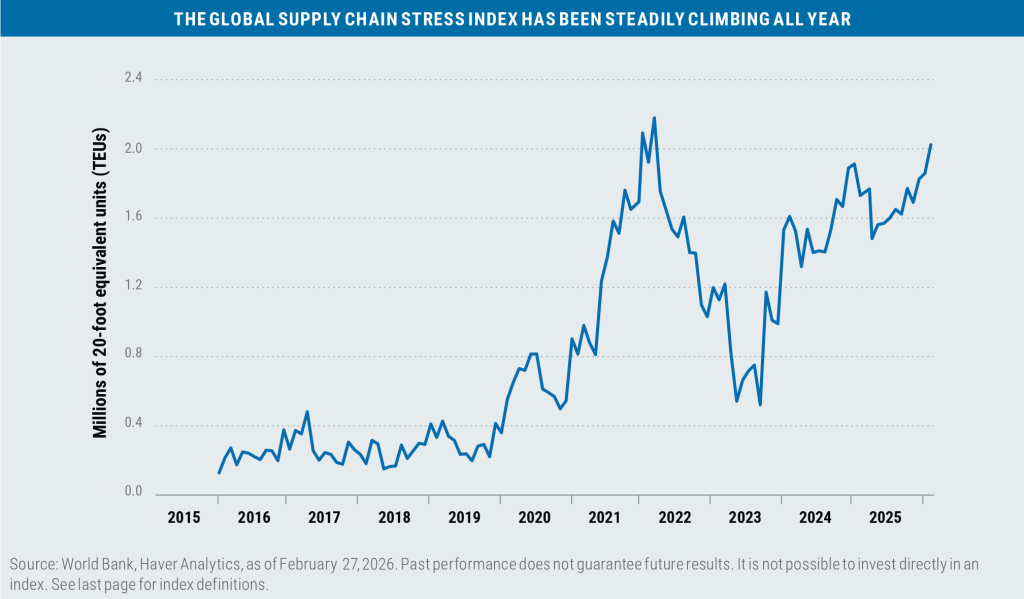
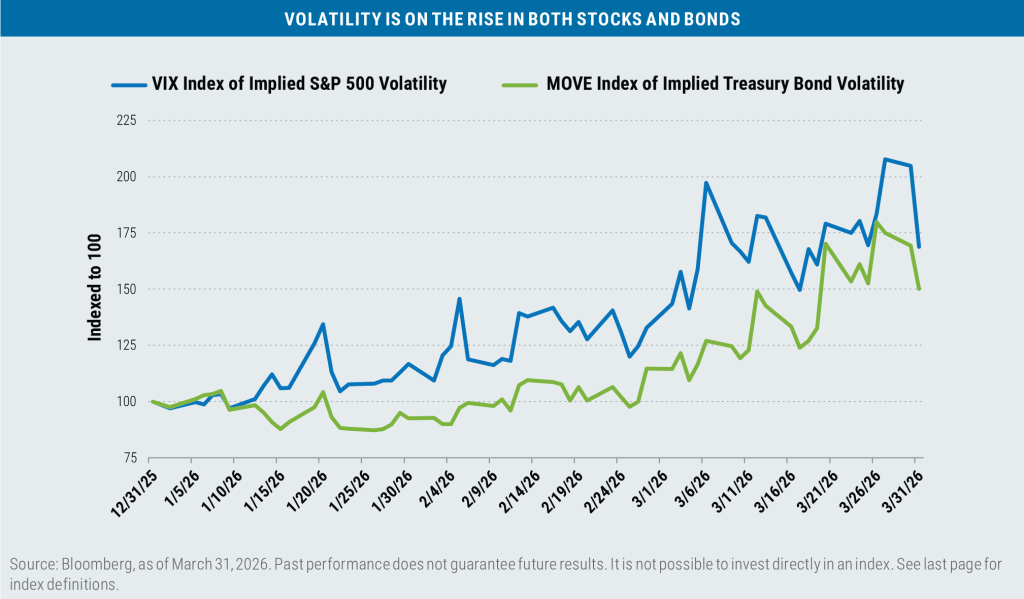
As a result, geopolitical risk and supply chain stress have spiked, volatility of both stocks and bonds has increased, the S&P 500 has bordered on a 10% correction, and concerns regarding inflation and growth have risen.
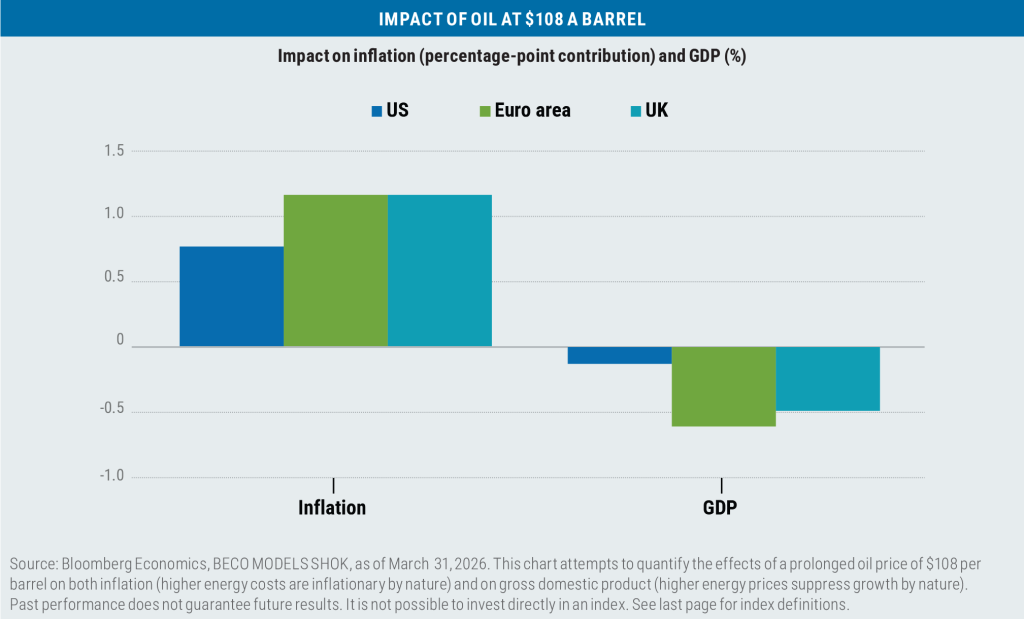
While asset prices may recover when military operations conclude, the damage to the region’s energy infrastructure (including targets hit by Iran in Saudi Arabia, Qatar, Kuwait, Bahrain, and the United Arab Emirates) will likely result in the price of oil and its distillates remaining elevated relative to levels prior to the conflict.
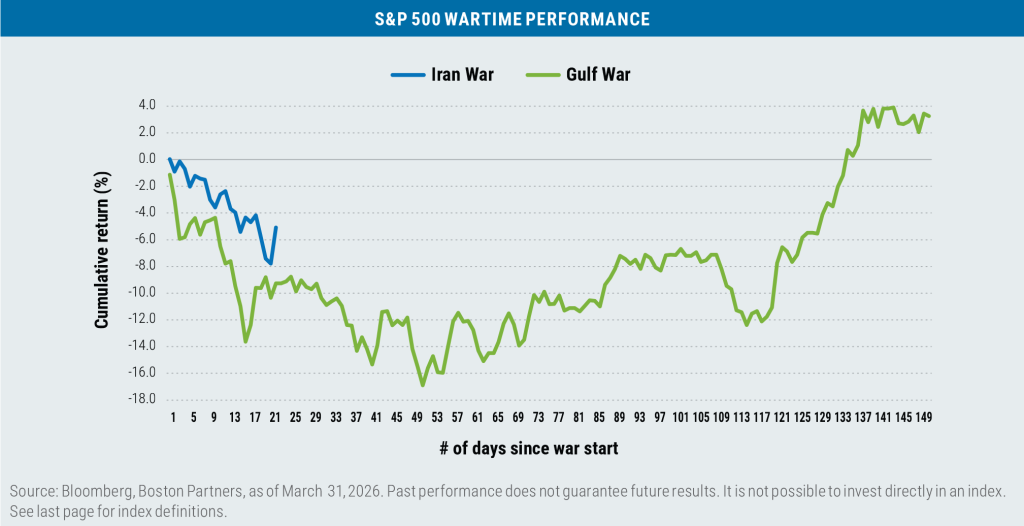
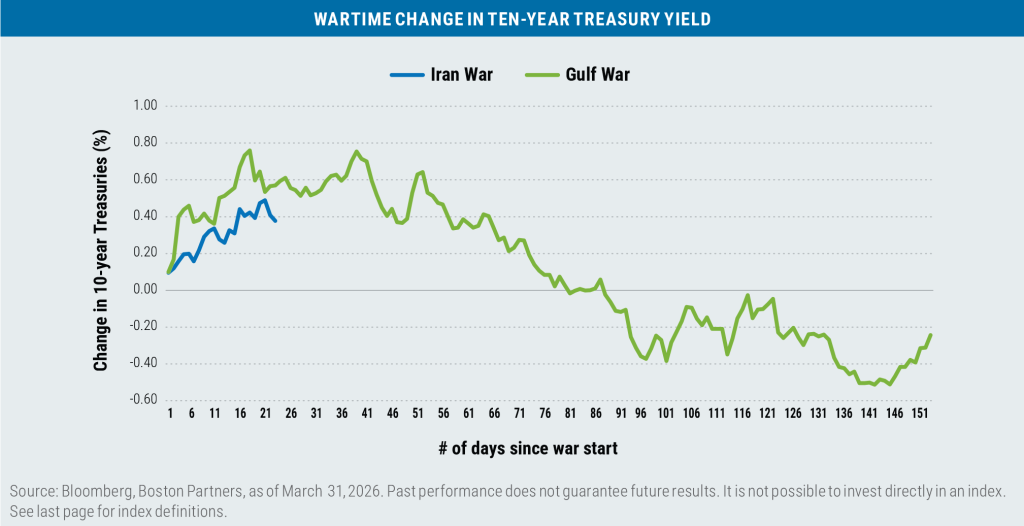
The hope is that the conflict will not become more protracted and devolve into something resembling the Gulf War, which lasted seven months, and that the final result is not just a military success, but also a strategic success.
Until the war’s resolution, however, we expect asset prices will remain volatile.

Boston Partners Global Investors, Inc. (“Boston Partners”) is an investment adviser registered with the SEC under the Investment Advisers Act of 1940. The views expressed in this commentary reflect those of the author as of the date of this commentary. Any such views are subject to change at any time based on market and other conditions and Boston Partners disclaims any responsibility to update such views. Past performance is not an indication of future results.
Discussions of securities, market returns, and trends are not intended to be a forecast of future events or returns. You should not assume that investments in the securities identified and discussed were or will be profitable.
Important information
AAA unleaded gasoline refers to a type of fuel that meets the standards set by the American Automobile Association (AAA) for quality and performance, and is sometimes used as a proxy for national gasoline prices. Beta is a measure of a portfolio’s market risk relative to its benchmark. In general, a beta higher than 1.00 indicates a more volatile portfolio and beta lower than 1.00 indicates a less volatile portfolio in relation to its benchmark. Bitcoin is the world’s most used cryptocurrency—a means of decentralized digital exchange that operates on peer-to-peer networks. Brent crude and West Texas Intermediate (WTI) crude are two types of more easily refined oil and serve as key benchmarks for oil prices. The CBOE Volatility Index (VIX) is a forward looking measure of expected volatility of the S&P 500 Index using the calculated midpoint of option bid/ask quotes. A correction is typically understood as a market drawdown of 10% (but less than 20%, which constitutes a bear market) from peak to trough. The Caldara and Iacoviello Geopolitical Risk (GPR) Index tracks the number of articles related to adverse geopolitical events in ten newspapers each month (as a share of the total number of news articles). The results are organized into eight categories: War Threats (Category 1), Peace Threats (Category 2), Military Buildups (Category 3), Nuclear Threats (Category 4), Terror Threats (Category 5), Beginning of War (Category 6), Escalation of War (Category 7), and Terror Acts (Category 8). The Geopolitical Threats (GPRT) Index includes words belonging to categories 1 to 5 above; the Geopolitical Acts (GPRA) Index includes words belonging to categories 6 to 8. The Global Industry Classification Standard (GICS) is a system developed by MSCI and S&P Dow Jones Indices to categorize companies into 11 sectors, 25 industry groups, and even more granular industries and sub-industries based on their principal business activities. Level 2 refers to the industry groups tier of the classification system. Gross domestic product (GDP) is the total market value of all the goods and services produced by a country and is a closely watched reflection of overall economic health. The Gulf War refers to military operation conducted by a broad coalition of countries in 1990 and 1991 to repel Iraqi forces from Kuwait. The Merrill Lynch Option Volatility Estimate (MOVE) Index is a measure of bond market volatility that tracks the expected fluctuations in U.S. Treasury yields based on option prices from various maturities (2, 5, 10, and 30 years). The World Bank’s Global Supply Chain Stress Index (GSCSI) measures the magnitude of shipping disruptions affecting global supply chains. Supply chain stress occurs when the time it takes to traverse a maritime shipping route exceeds the long-term average. The index measures the backlog of freight and is measured in millions of 20-foot equivalent units (essentially, the number of standard 20-foot shipping containers, in millions, that are delayed or stuck in transit).
Index definitions
The Bloomberg U.S. Aggregate Bond Index tracks the performance of intermediate-term investment-grade bonds traded in the United States. The Bloomberg U.S. Dollar Index (DXY) is used to measure the value of the dollar against a basket of six foreign currencies. The value of the index is a fair indication of the dollar’s value in global markets. The ICE BofA U.S. Corporate, Government & Mortgage Index tracks the performance of U.S. dollar-denominated investment-grade fixed-rate debt, including corporate bonds, government securities, and mortgage-backed securities. The Magnificent Seven stocks are a group of high-performing and influential companies in the U.S. stock market: Alphabet, Amazon, Apple, Meta Platforms, Microsoft, Nvidia, and Tesla. The MSCI Emerging Markets (EM) Currency Index tracks the performance of emerging market currencies relative to the U.S. dollar where the weight of each currency is equal to its country weight in the MSCI Emerging Markets Index. The MSCI EAFE Index tracks the performance of large- and mid-cap equities traded across global developed markets, excluding the United States and Canada. The MSCI Emerging Markets Index tracks the performance of large- and mid-cap equities traded in global emerging markets. The MSCI World ex U.S. Index tracks the performance of large- and mid-cap equities traded across global developed markets, excluding the United States. The Russell 1000 Index tracks the performance of the 1,000 largest companies traded in the United States. The Russell 2000 Index tracks the performance of the 2,000 smallest companies traded in the United States. The Russell 1000 Growth and Value Indexes track the performance of those large-cap U.S. equities in the Russell 1000 Index with growth and value style characteristics, respectively. The Russell 2000 Growth and Value Indexes track the performance of those small-cap U.S. equities in the Russell 2000 Index with growth and value style characteristics, respectively. The Russell Midcap Growth and Value Indexes track the performance of those mid-cap U.S. companies in the Russell 1000 Index with growth and value style characteristics, respectively. The S&P 500 Index tracks the performance of the 500 largest companies traded in the United States. The S&P 500 Equal Weight Index also tracks the performance of the 500 largest companies traded in the United States, but weights each company equally, rather than proportionally according to market cap. S&P credit ratings, which range from AAA (highest) to D (default), are assigned by S&P Global to individual companies to indicate their relative creditworthiness. It is not possible to invest directly in an index.
Market capitalization breakpoints
The breakpoints for capitalization ranges should be viewed only as guideposts and will change over time. In general, FTSE Russell (which maintains a number of stock-market indexes based on company size) considers small-cap stocks to have market caps of between $150 million and $7 billion, mid caps to have market caps between $7 billion and $150 billion, and large caps to be those companies with market caps above $150 billion.
Boston Partners Global Investors, Inc. (Boston Partners) is composed of three divisions, Boston Partners, Boston Partners Private Wealth, and Weiss, Peck & Greer (WPG) Partners, and is an indirect, wholly owned subsidiary of ORIX Corporation of Japan (ORIX).
8810003.2