
Mullaney on the Markets
Cutting through the fog
By Michael Mullaney | Director of Global Markets Research
Published May 2026
Despite entering the third month of the Iran conflict, stocks cut through “The Fog of War” in April, with investors instead choosing to focus on the results of a particularly strong Q1 earnings season and a ceasefire in the Middle East. The resulting 10.49% gain in the S&P 500 was its best single month return since November 2020 and only the fifth monthly return exceeding 10% on a total return basis since 1988. For the month “Big Tech” once again led the way.
Bonds eked out a gain of 0.11% for the month as measured by the Bloomberg U.S. Aggregate Bond Index, with coupon income barely offsetting price losses, the result of interest rates rising by an average of 6 basis points for Treasury securities with maturities ranging from 2-years to 30-years.
Returns for International stocks were lower than for the S&P 500, though still a robust 7.49% for the MSCI World ex USA Index.
Year-to-date, the S&P 500 is back in positive territory with a return of 5.69%, while the Bloomberg “Agg” index is up by a measley 0.07%. The MSCI World ex USA Index has gained 6.87% since December.
Sector returns in April
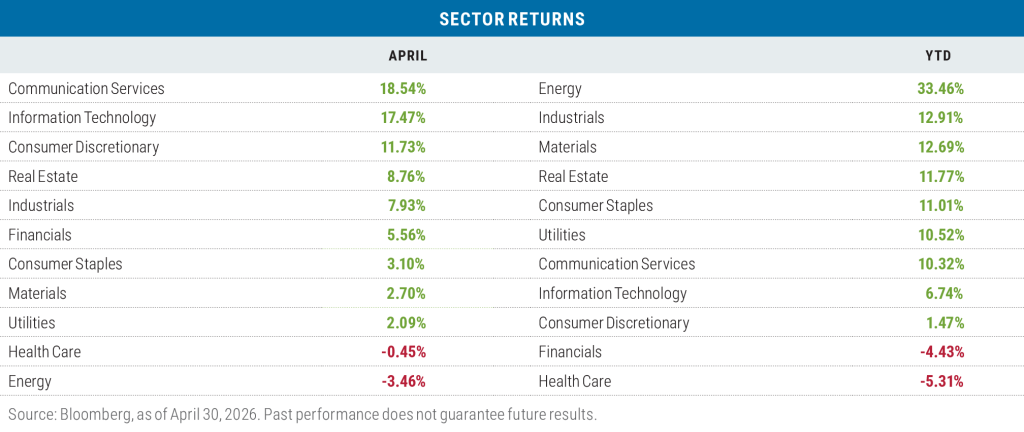
Nine of the eleven sectors that comprise the S&P 500 rebounded into positive territory during April, led by the three sectors where the Magnificent Seven—Apple, Nvidia, Amazon, Alphabet, Microsoft, Meta, and Tesla—happen to reside. For the month, the “Mag 7” returned 14.88%, led by a 33.52% gain in Alphabet (Google). The stock gained 9.97% on the last day of the month after reporting blowout first-quarter results with revenue jumping to $94.7 billion, far exceeding analysts’ expectations of $91.6 billion. The company reported earnings per share of $5.11, nearly double what analysts had projected. The stock was responsible for 93% of the Communication Services’ 18.54% gain for the month.
Returns were concentrated in fewer stocks once again as the “S&P 493” returned 8.14%, the S&P 500 Equal Weighted Index gained just 5.97% for the month, and only 23% of S&P 500 stocks beat the S&P 500 return, the 4th lowest tally since 1986.
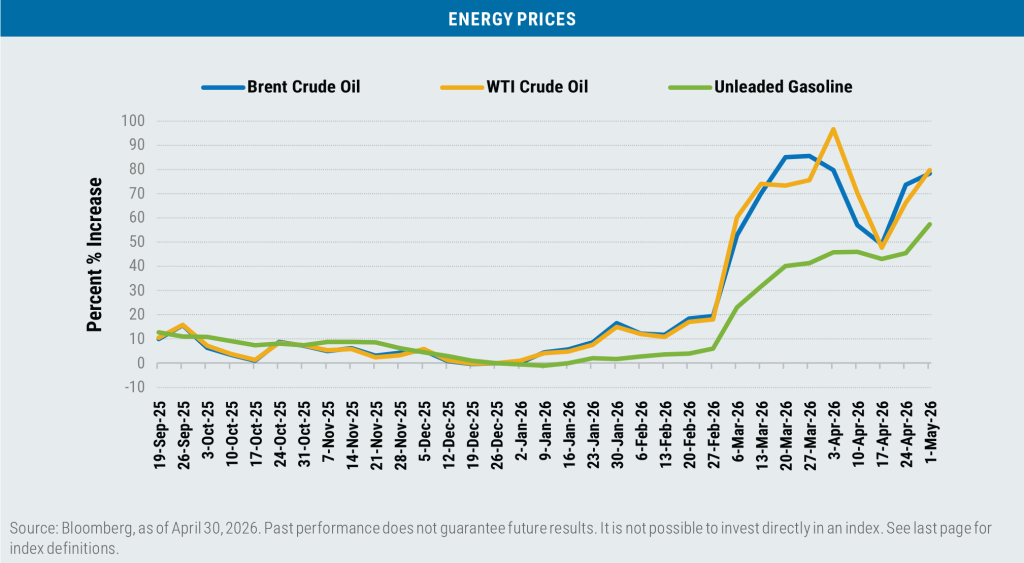
The Energy sector pulled up the rear during April with a loss of -3.46% as the price of WTI crude oil closed the month at $105.07 per barrel, down from an intra-month high of $112.95 per barrel. The Middle East ceasefire (including Israel and Lebanon) coupled with negotiations between the U.S. and Iran on terms for a resolution to the war, helped to sooth the frayed nerves of investors and provided some relief in energy prices.
Year-to-date, the Energy sector still maintains the pole position, with the price of WTI crude oil up by 83%, Brent crude up 96% and regular unleaded gasoline up 55% since December.
The Health Care sector remains the YTD laggard, with two-thirds of the 58 stocks in the sector in the loss column. Eli Lilly & Company, with a loss of -12.89% since December, is responsible for 38% of the sector’s underperformance. The company is experiencing somewhat slower sales of its GLP-1 weight loss drugs overseas and somewhat muted demand for its new once-a-day oral GLP-1 medication called Foun-dayo—though remember the stock was up over 40% in 2025
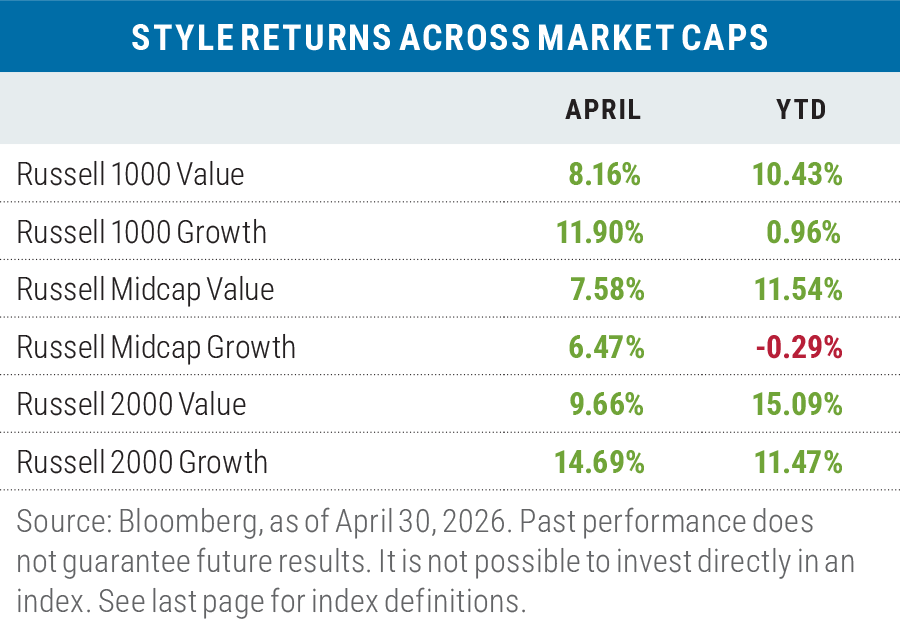
Growth rebounds in April
Given the strength of Big Tech names, it comes with little surprise that the Russell 1000 Growth Index would outperform the Russell 1000 Value Index during April, as the Russell 1000 Growth Technology Sector contributed to 58% of the overall index return. The Mag 7 alone accounted for 61% of the return of the Russell 1000 Growth Index.
Growth was also surprisingly strong in the small-cap space, with the Russell 2000 Growth Index beating the Russell 2000 Value Index by +5.03%, with Tech responsible for 35% of the index return for the month but closely followed by Industrials, which contributed 34% of the Russell 2000 Growth Index return.
Only in mid-caps did value outperform growth during April. Here technology once again prevailed, but it was the result of the Russell Mid-Cap Value Technology Sector returning 26.42% to the 12.10% return for the Russell Mid-Cap Growth Technology Sector.
Year to date, value continues its lead over growth by an average of 8.31% across the three market capitalization ranges listed for the Russell benchmarks, still the best start to a calendar year for value since 2022 when value went on to outperform growth by nearly 19% on average across the three market capitalization ranges.
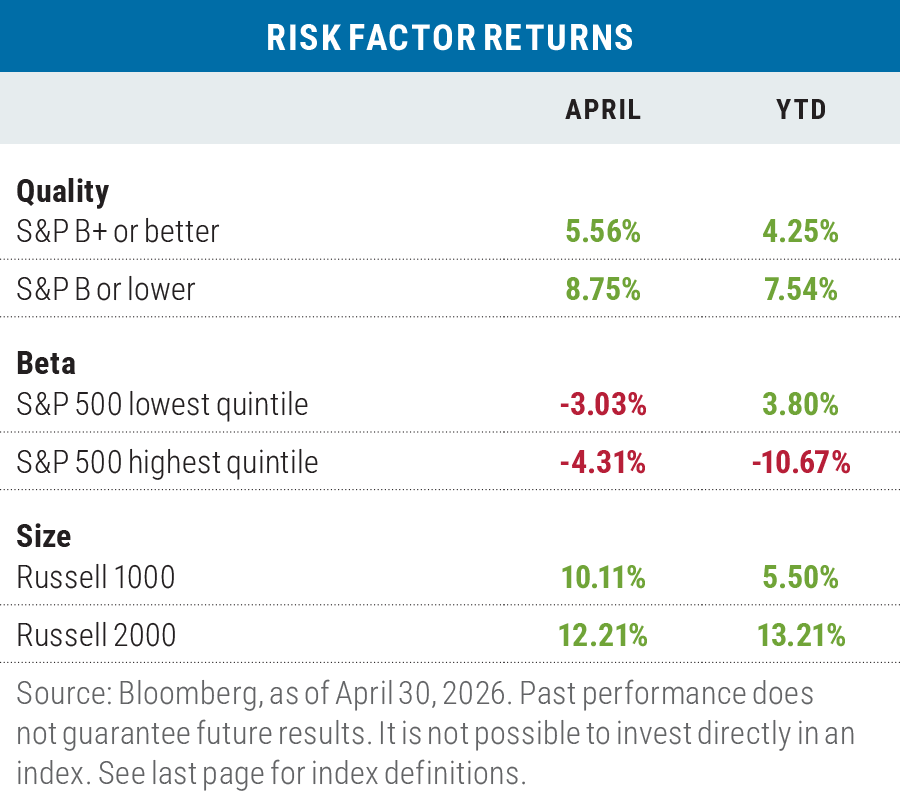
Mostly “risk on” in April
In April the risk-on factors of low quality and small size prevailed, but the highest-beta quintile of the S&P 500 actually lagged the lowest-beta quintile, a twist in results. Likewise for the year-to-date factor results, where low quality and small size were winners, but high beta lagged badly.
International stocks trail the S&P 500 in April
Developed market international stocks (as measured by the MSCI EAFE Index) lagged the S&P 500 in April in both local currency and U.S. Dollar terms, while emerging-market stocks beat the S&P 500 on both fronts, once again a sign of more risk-on trading than not. Returns in dollar terms were higher for both sets of bourses as both developed and emerging-market currencies appreciated relative to the dollar.
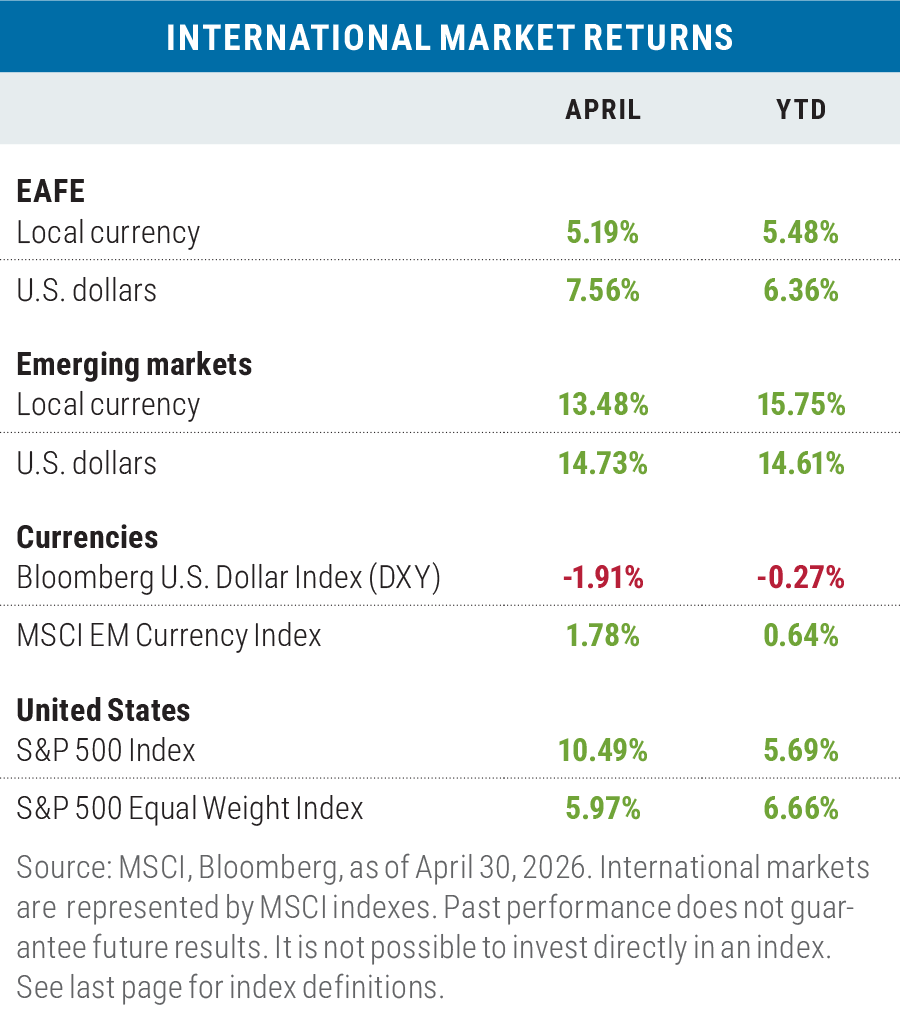
In the emerging markets, there were exceptional returns generated in South Korea (38.23%) and Taiwan (26.22%), both significant hubs for semiconductor chip manufacturing that is helping fuel the A.I. buildout craze. Year-to-date, developed-market stocks have lagged the S&P 500 in local currency terms but lead in U.S. dollar terms as the dollar has weakened. Emerging-market stocks have beaten the S&P 500 soundly in local currency and dollar terms, but again have done better in dollar terms as the greenback has been on the weak side.
Looking ahead
In April, investors in the stock market acted as if they truly believed “The war is over,” as claimed by President Trump, with little attention paid to any further ramifications or repercussions from the conflict—instead choosing to focus on earnings growth and a resilient U.S. economy.
Indeed, Q1 earnings growth has been robust for the 63% of the S&P 500 companies that have reported, with a blended
growth rate (those companies that have reported plus estimates of those yet to report) of 27.1% (the highest growth since Q4 2021) with 84% of the companies beating expectations with an average upside surprise of 8.5%.
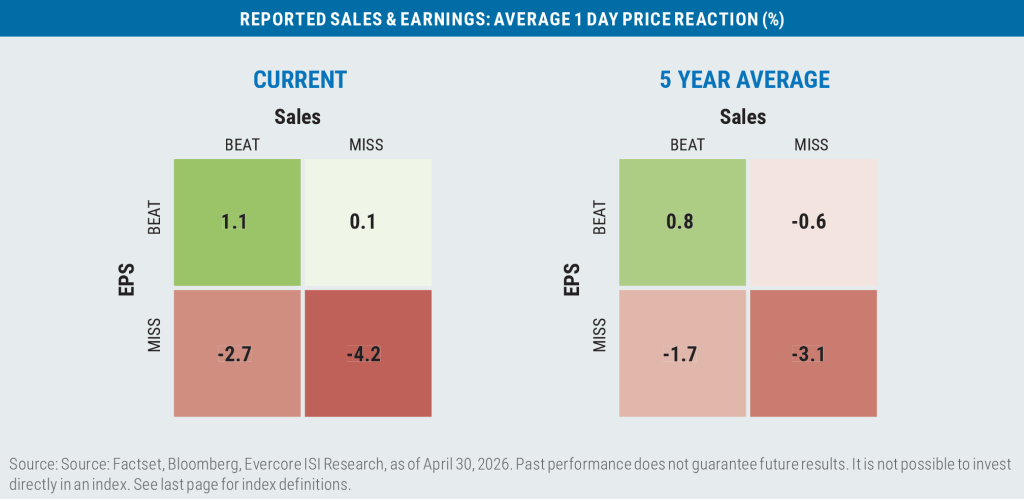
Prices of the stocks that beat expectations on both earnings and revenues have been rewarded, while those that missed on both accounts have been punished.
U.S. GDP also rebounded from a sluggish Q4 2025, with Y-O-Y growth pegged at 2.0% and led by continued strength in
Consumption and a spurt in Fixed Investment.
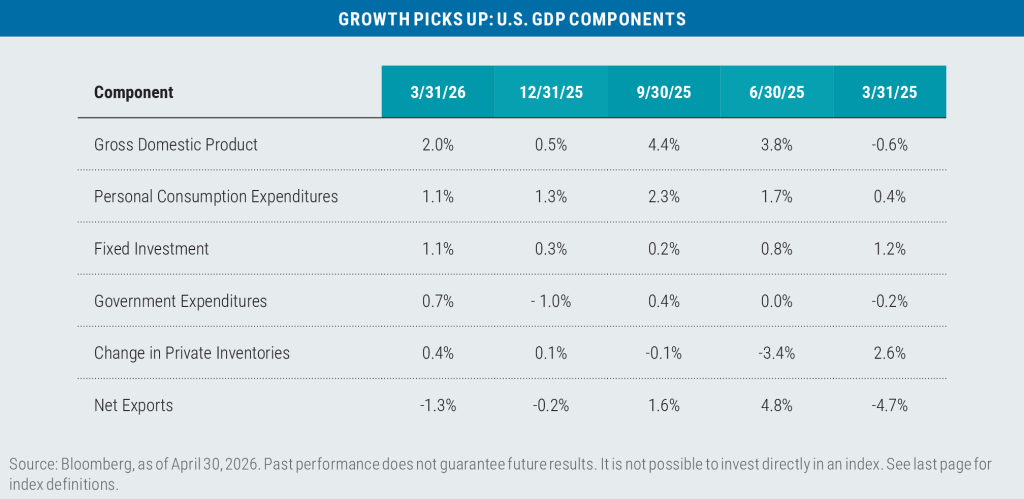
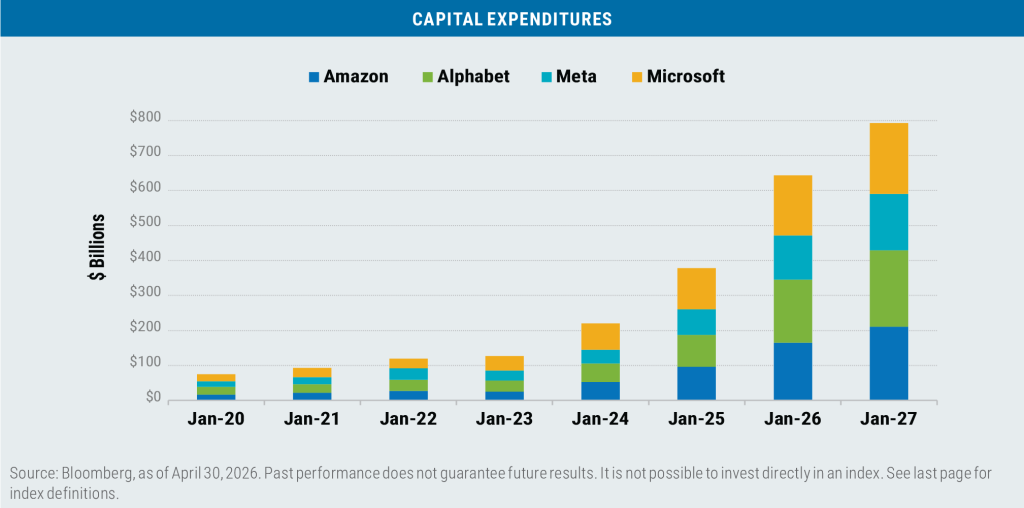
Fixed Investment is benefitting from the continued wave of A.I. data center expansion plans, led by the so-called four
hyperscalers (Alphabet, Amazon, Meta, and Microsoft) whose realized and projected capital expenditures continue
to soar.
There is more skepticism on behalf of bond investors, as for all intents and purposes the Strait of Hormuz remains
essentially closed. This was noted in the April meeting of the Federal Open Market Committee (FOMC) and most likely was one of the reasons three members of the committee looked to remove language that signaled a bias towards lowering interest rates going forward, desiring a more neutral stance.
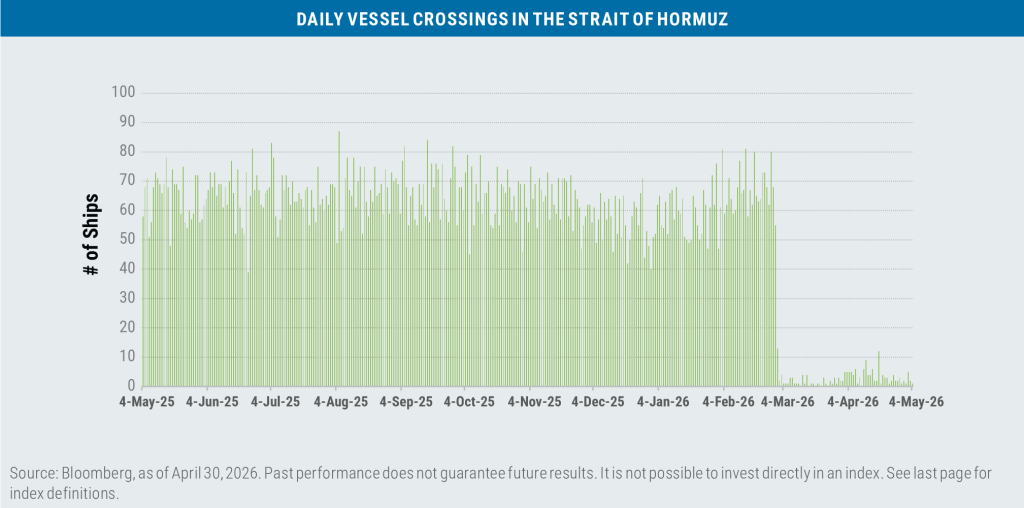
With 20% of the world’s oil transmission shut off, energy prices have spiked.
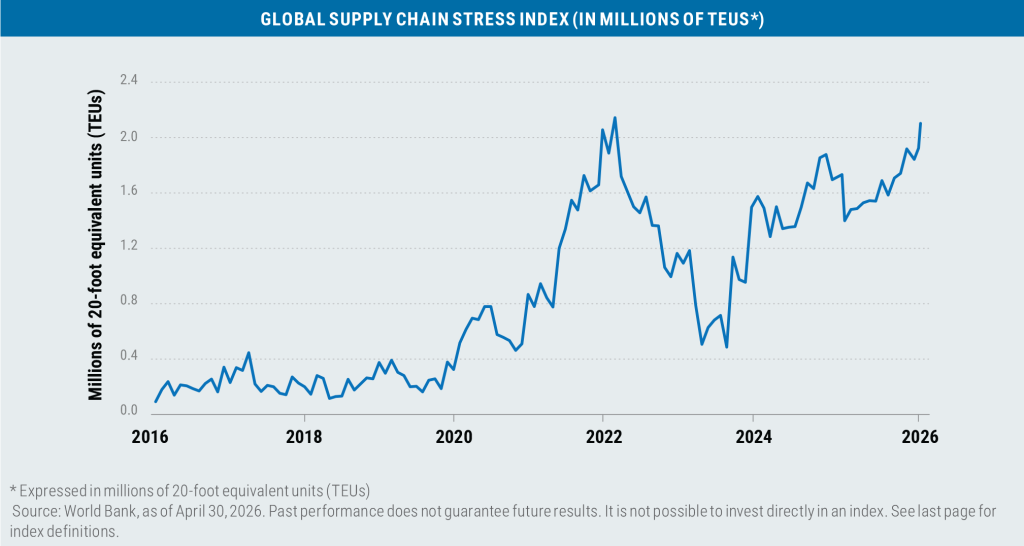
And global supply chain stress has risen to COVID-19 like levels.
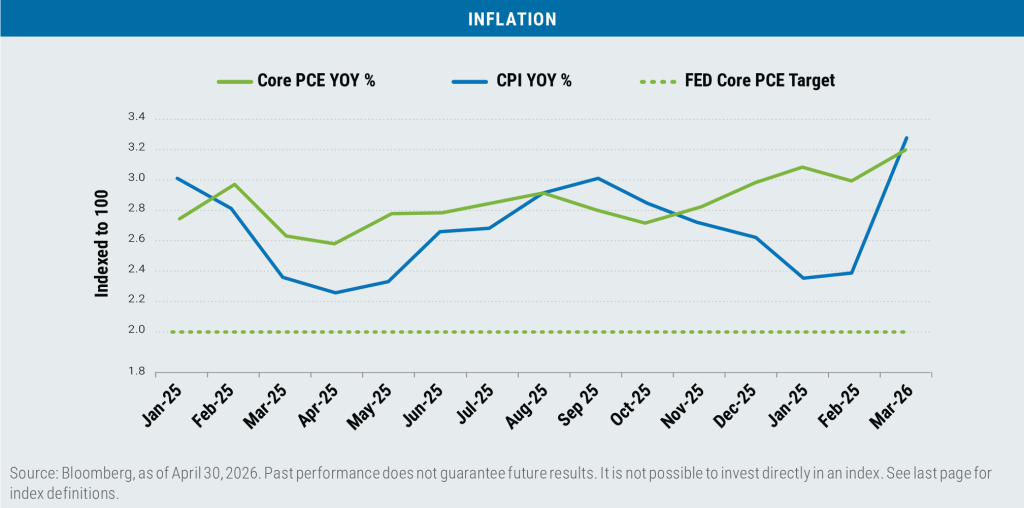
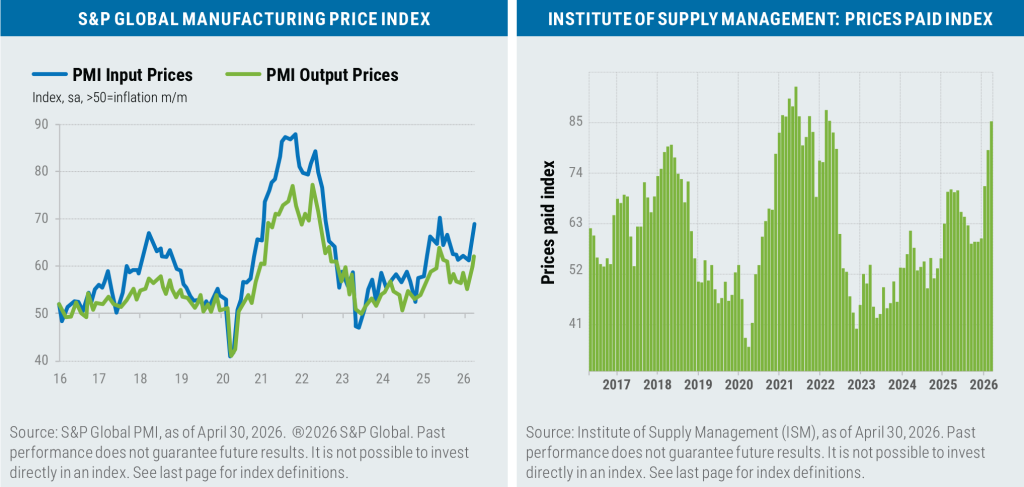
This, this coupled with tariffs has put upward pressure on inflation readings.
After mixed messaging at the start of the war, the administration has solidified the goal/purpose of the conflict as the elimination of Iran’s capability to produce a nuclear weapon, a measure that has bipartisan support. The opening of the Strait of Hormuz now seems to be a secondary, but still a must, condition for any peace agreement. Regime change and the curtailment of weapon production by Iran now seem to have taken a back seat to the other measures.
While there are reports of discord among Iran’s leadership, it seems that the country’s ability to continue with its nuclear initiatives is mutually agreed upon between its ruling leaders and the Islamic Revolutionary Guard Corps (IRGC).
At this juncture, this appears to be the so-called “red line” for both countries and most likely the root cause of continued volatility in the markets.
As of this writing, a tenuous cease fire remains in place between the U.S. and Iran, while Israel and Hezbollah/Lebanon seem even less likely to maintain a truce.
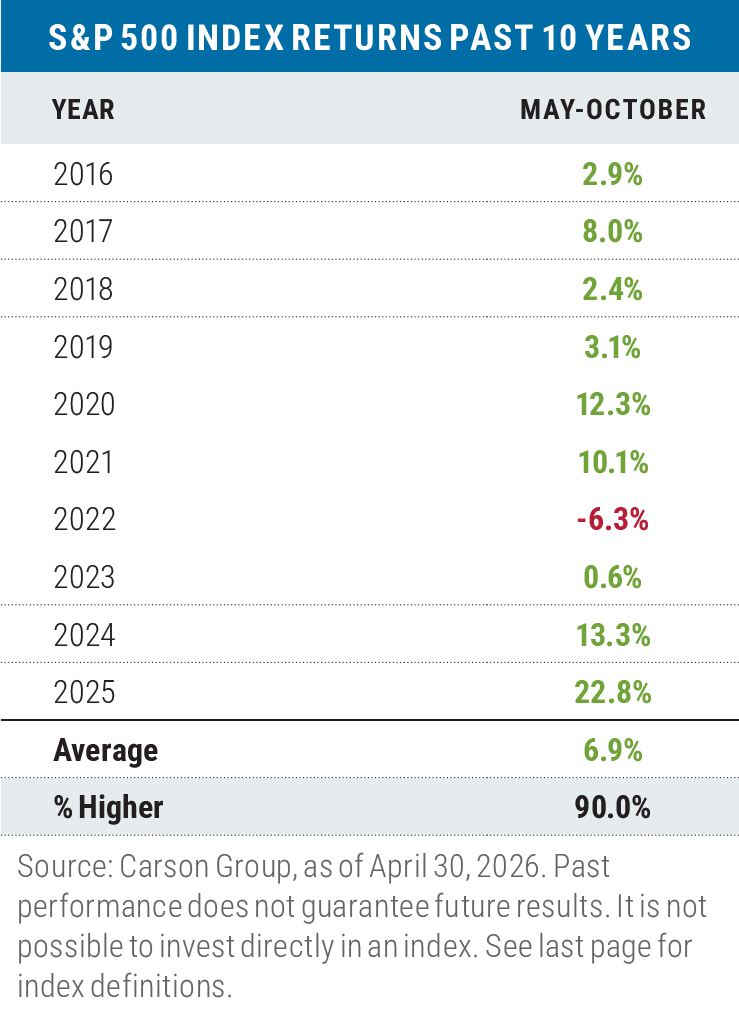
Finally, the old adage “Sell in May and Go Away” may need to be mothballed as over the last 10 years this has proven to be a losing strategy on average.

Boston Partners Global Investors, Inc. (“Boston Partners”) is an investment adviser registered with the SEC under the Investment Advisers Act of 1940. The views expressed in this commentary reflect those of the author as of the date of this commentary. Any such views are subject to change at any time based on market and other conditions and Boston Partners disclaims any responsibility to update such views. Past performance is not an indication of future results.
Discussions of securities, market returns, and trends are not intended to be a forecast of future events or returns. You should not assume that investments in the securities identified and discussed were or will be profitable.
Important information
AAA unleaded gasoline refers to a type of fuel that meets the standards set by the American Automobile Association (AAA) for quality and performance, and is sometimes used as a proxy for national gasoline prices. Beta is a measure of a portfolio’s market risk relative to its benchmark. In general, a beta higher than 1.00 indicates a more volatile portfolio and beta lower than 1.00 indicates a less volatile portfolio in relation to its benchmark. Brent crude and West Texas Intermediate (WTI) crude are two types of more easily refined oil and serve as key benchmarks for oil prices. Earnings per share (EPS) is a company’s profit allocated to each outstanding share of common stock. The Global Industry Classification Standard (GICS) is a system developed by MSCI and S&P Dow Jones Indices to categorize companies into 11 sectors, 25 industry groups, and even more granular industries and sub-industries based on their principal business activities. Level 2 refers to the industry groups tier of the classification system. Gross domestic product (GDP) is the total market value of all the goods and services produced by a country and is a closely watched reflection of overall economic health. Purchasing Managers’ Index (PMI) is a survey-based index that summarizes whether business conditions are expanding, unchanged, or contracting in manufacturing or services. Readings above 50 generally indicate expansion; below 50 indicate contraction. The World Bank’s Global Supply Chain Stress Index (GSCSI) measures the magnitude of shipping disruptions affecting global supply chains. Supply chain stress occurs when the time it takes to traverse a maritime shipping route exceeds the long-term average. The index measures the backlog of freight and is measured in millions of 20-foot equivalent units (essentially, the number of standard 20-foot shipping containers, in millions, that are delayed or stuck in transit).
Index definitions
The Bloomberg U.S. Aggregate Bond Index tracks the performance of intermediate-term investment-grade bonds traded in the United States. The Bloomberg U.S. Dollar Index (DXY) is used to measure the value of the dollar against a basket of six foreign currencies. The value of the index is a fair indication of the dollar’s value in global markets. The Consumer Price Index (CPI) measures the average change over time in prices paid by consumers. Core Personal Consumption Expenditures (PCE) measures changes over time in goods and services excluding food and energy costs. The ICE BofA U.S. Corporate, Government & Mortgage Index tracks the performance of U.S. dollar-denominated investment-grade fixed-rate debt, including corporate bonds, government securities, and mortgage-backed securities. Institute of Supply Management Prices Paid Index measures changes in the price of raw materials as an indication of inflation. The Magnificent Seven stocks are a group of high-performing and influential companies in the U.S. stock market: Alphabet, Amazon, Apple, Meta Platforms, Microsoft, Nvidia, and Tesla. The MSCI Emerging Markets (EM) Currency Index tracks the performance of emerging market currencies relative to the U.S. dollar where the weight of each currency is equal to its country weight in the MSCI Emerging Markets Index. The MSCI EAFE Index tracks the performance of large- and mid-cap equities traded across global developed markets, excluding the United States and Canada. The MSCI Emerging Markets Index tracks the performance of large- and mid-cap equities traded in global emerging markets. The MSCI World ex U.S. Index tracks the performance of large- and mid-cap equities traded across global developed markets, excluding the United States. The Russell 1000 Index tracks the performance of the 1,000 largest companies traded in the United States. The Russell 2000 Index tracks the performance of the 2,000 smallest companies traded in the United States. The Russell 1000 Growth and Value Indexes track the performance of those large-cap U.S. equities in the Russell 1000 Index with growth and value style characteristics, respectively. The Russell 2000 Growth and Value Indexes track the performance of those small-cap U.S. equities in the Russell 2000 Index with growth and value style characteristics, respectively. The Russell Midcap Growth and Value Indexes track the performance of those mid-cap U.S. companies in the Russell 1000 Index with growth and value style characteristics, respectively. S&P 493 refers to the subset of the S&P 500 Index excluding the “Magnificent Seven” mega cap stocks. The S&P 500 Index tracks the performance of the 500 largest companies traded in the United States. The S&P 500 Equal Weight Index also tracks the performance of the 500 largest companies traded in the United States, but weights each company equally, rather than proportionally according to market cap. S&P credit ratings, which range from AAA (highest) to D (default), are assigned by S&P Global to individual companies to indicate their relative creditworthiness. It is not possible to invest directly in an index. S&P Global Manufacturing Price Index measures the health of the global economy based on surveys of senior executives at 28,000 companies.
Market capitalization breakpoints
The breakpoints for capitalization ranges should be viewed only as guideposts and will change over time. In general, FTSE Russell (which maintains a number of stock-market indexes based on company size) considers small-cap stocks to have market caps of between $150 million and $7 billion, mid caps to have market caps between $7 billion and $150 billion, and large caps to be those companies with market caps above $150 billion.
Boston Partners Global Investors, Inc. (Boston Partners) is composed of three divisions, Boston Partners, Boston Partners Private Wealth, and Weiss, Peck & Greer (WPG) Partners, and is an indirect, wholly owned subsidiary of ORIX Corporation of Japan (ORIX).
8916884.1