
A value-based
case for today’s
European banks
June 2026
Higher stock prices on European banks are no reason to reduce exposure. In this paper, we examine the value case for further upside potential.
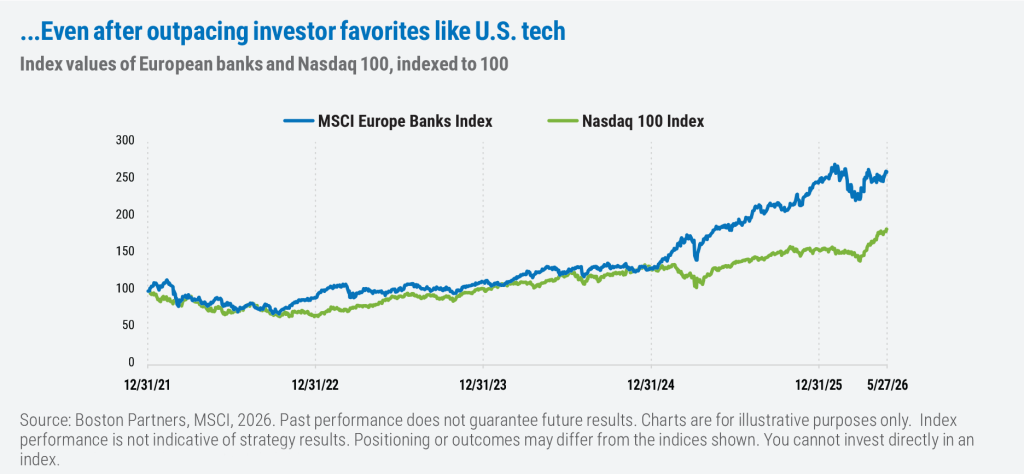
European bank stocks have enjoyed a multiyear run of strong performance, outpacing the Stoxx 50 Index since early 2024 amid increased profitability. Today’s European banks are doing what U.S. banks did from 2013–2019: rebuilding capital, restructuring cost bases, and returning to double-digit returns on equity. Yet the sector continues to trade at a discount to its own growth rate and return profile, offering a compelling risk/reward dynamic. In our estimation, there are several compelling reasons why investors should continue to consider these stocks today.
Higher returns are structural, not cyclical
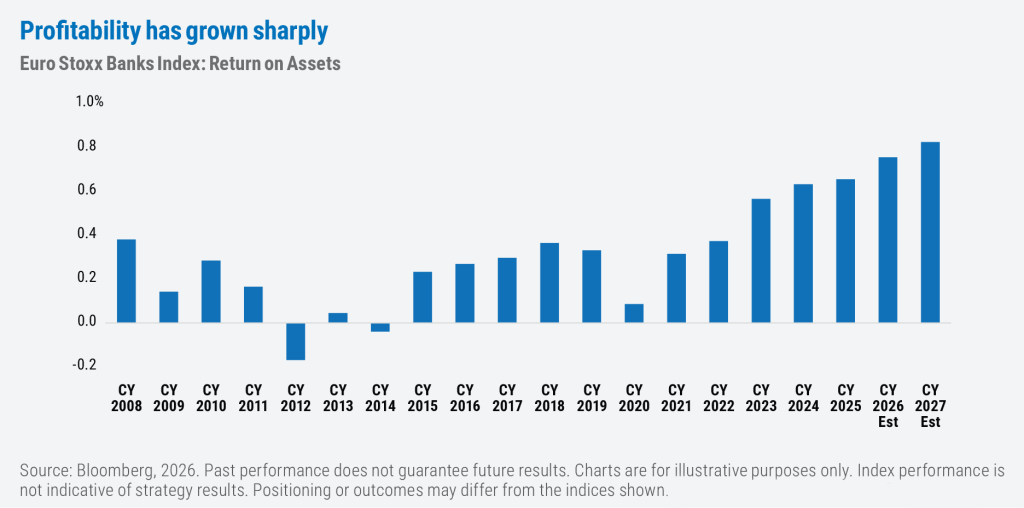
Since the pandemic, European banks have gradually transformed from perennial value traps into one of the more compelling profitability stories in global equities. A key driver has been the return to a more normalized interest rate environment, which has allowed banks to earn a healthier spread on their large deposit bases after years of zero and negative rates that weighed on core earnings. What makes the turnaround credible is that it shows up not just in returns on equity, but in returns on assets, now near multi-year highs, signaling that the improvement reflects genuine earning power rather than leverage or higher risk lending.
Additional drivers include the fact that banks are actively removing costs through technology and restructuring, and in some cases dramatically shrinking their workforces. Ongoing cost discipline and other efficiency transformations (including AI adoption) are supporting business momentum by providing operating leverage.
M&A activity has also spiked in recent years, with some banks looking to acquire new capabilities such as wealth and asset management or payments. The wealth franchises of several European banks are growing assets under management by 8–12% annually. These are higher-quality businesses being valued at the low-single-digit price-to-earnings of the bank wrapper. As a result of the increase in wealth/asset management services, fee income has grown materially such that European banks are less dependent on pure net interest margins than U.S. regional banks.
Structural hedges are an underappreciated piece of the sector’s profitability, in our view. Many UK/European banks built 5–7-year hedge portfolios at low rates that are now rolling onto materially higher yields, supporting net interest income. We believe this is a multiyear tailwind that would even survive a scenario of future ECB cuts.
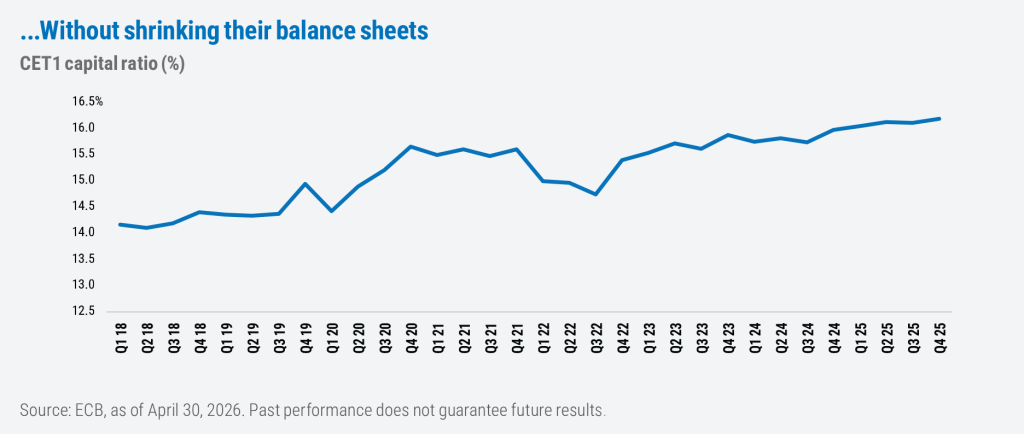
Finally, capital allocation discipline has improved across management teams in the sector. More recent M&A activity, for example, has also become more selective and value-accretive in many cases. And Common Equity Tier 1 (CET1) ratios average roughly 16%, well above the regulatory minimums. These are different businesses than the pre-2022 banks that traded at 0.5x book value.
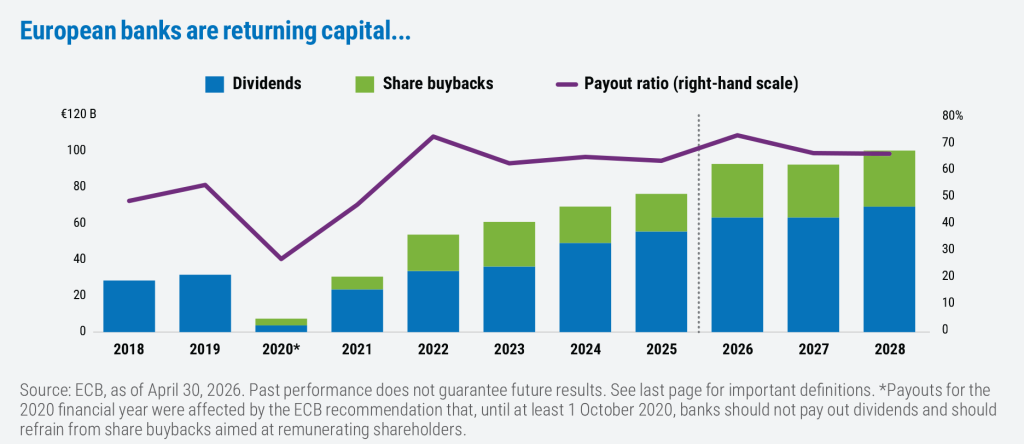
Banks are returning capital to shareholders organically
European banks have historically traded at a discount to U.S. banks, but share buybacks are helping close the gap. Between 2020 and 2024, publicly listed European banks announced 75 buyback programs worth €61 billion. Since then, payouts have continued to increase with many banks pledging to return 100% of their annual earnings to shareholders.
This phase of evolution for European banks is analogous to what U.S. banks went through in 2014–2018 when payout ratios moved from ~40% to ~100%+ via CCAR-driven buybacks. We think European banks are much closer to the middle of this journey than its end. Perhaps most important for investors, this capital return is being funded out of organic profit generation, not balance sheet shrinkage, which is why CET1 ratios have stabilized around 16% despite elevated distributions. Banks are now more profitable, using less leverage and returning more capital to investors via dividends and buybacks—all while being safer and holding stronger buffers.
- ECB, 2025.
- Comprehensive Capital Analysis and Review (CCAR) is a regulatory framework introduced by the U.S. Federal Reserve after the 2008 financial crisis and was designed to ensure that large U.S. banks maintain robust capital planning processes and have enough capital to survive severe economic downturns.
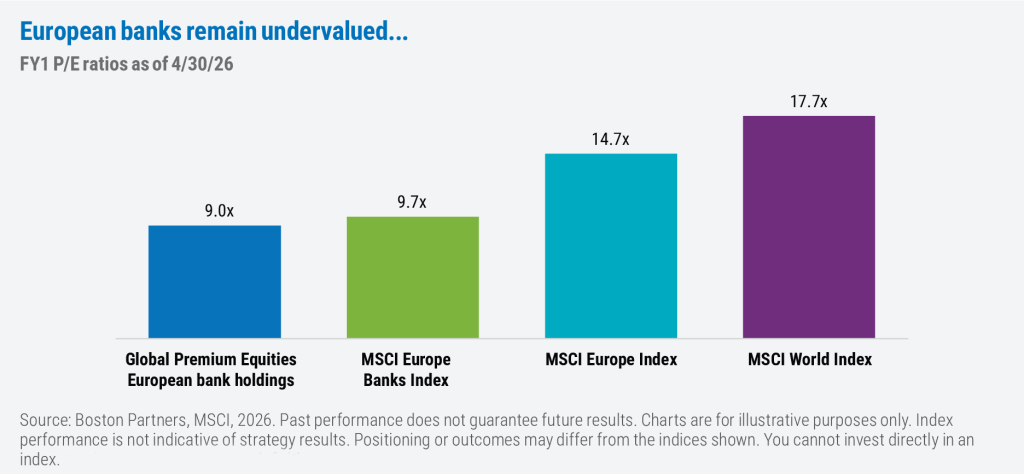
Valuations remain compelling
Although the deep-value recovery trade for European banks may be over, the sector is transitioning to a quality-compounder story, in our view. Today, the sector trades around 8.9x for low double-digit 2027 estimated earnings growth. Therein lies the value proposition: The valuation multiple for our holdings continues to reflect a disconnect between the underlying earnings growth and prospective P/E multiple. That dynamic is much more limited in the U.S. banking opportunity set, thus our overweight to European spread lending institutions. What’s more, total shareholder yield (dividends + buybacks) is running ~8% annually, establishing a hard cash floor for investors.
- ECB, 2026.
European banks are in a new phase of profitability and shareholder friendly behavior and are
well-positioned for further upside, in our view.
Important information
The views expressed in this commentary reflect those of the author as of the date of this commentary. Any such views are subject to change at any time based on market and other conditions and Boston Partners disclaims any responsibility to update such views. Past performance is not an indication of future results.
Discussions of securities, market returns, and trends are not intended to be a forecast of future events or returns. You should not assume that investments in the securities identified and discussed were or will be profitable.
Nasdaq 100 Index tracks the performance of the 100 largest and most actively traded non-financial companies listed on the Nasdaq Stock Market. Stoxx 50 Index tracks the performance of 50 of the largest and most highly traded blue-chip companies in the Eurozone. MSCI European Banks Index measures the performance of large and mid-cap bank stocks across 15 developed European markets. MSCI Europe Index tracks the performance of large and mid-cap companies across developed markets in Europe. MSCI World Index tracks the performance of large- and mid-cap companies across 23 developed countries.
Return on assets is a profitability metric that measures how profitable a company is relative to its total assets. Net interest income (NII) is the difference between the revenue a financial institution generates from its interest-bearing assets and the interest expenses it pays on its liabilities. Common Equity Tier 1 ratio is a key financial metric used by regulators to measure a bank’s core capital strength. Price/Earnings ratio measures a company’s current share price relative to its earnings per share. Price/Book ratio measures a company’s market value relative to its book value (total assets minus total liabilities). Net Interest Margin measures the difference between the interest income a bank earns on loans and investments and the interest it pays out on deposits and borrowings, relative to the amount of its interest-earning assets. Comprehensive Capital Analysis and Review (CCAR) is a US Federal Reserve annual stress-testing exercise ensures these firms have robust capital planning processes and enough capital to continue lending and operations during severe economic downturns. Total Shareholder Yield measures the total amount of cash a company returns to its investors, expressed as a percentage of its total market capitalization. Non-performing loan (NPL) is a loan where the borrower has stopped making scheduled payments for a prolonged period, typically 90 days or more. The EU Banking Package refers to the final, comprehensive package of global banking regulations designed to restore credibility in banks’ risk assets following the 2008 financial crisis.
Boston Partners Global Investors, Inc. (Boston Partners) is composed of three divisions, Boston Partners, Boston Partners Private Wealth, and Weiss, Peck & Greer (WPG) Partners, and is an indirect, wholly owned subsidiary of ORIX Corporation of Japan (ORIX).
8962703.1
Large Cap Value
Our flagship U.S. equity strategy targeting attractively valued large-cap companies.