
Mullaney on the Markets
Tariff turmoil, A.I. disruption
jitters & conflict in the
Middle East spook stocks
By Michael Mullaney | Director of Global Markets Research
Published March 2026
A ruling by the U.S. Supreme Court against President Trump’s use of The International Emergency Economic Powers Act (IEEPA) to impose tariffs on foreign goods entering the United States, fear that the use of A.I. models could lead to significant job losses, and a military strike on Iran by the United States and Israel on the final day of the month broke a string of nine consecutive months of positive returns for the S&P 500 Index, which fell -0.76% during February. Price losses during the month were concentrated within relatively few stocks, as the S&P 500 Equal-Weighted Index posted a positive return of +3.55% during the month, and 321 (64%) of the stocks that comprise the overall index produced gains.
Safe-haven assets benefited from the turmoil: The Bloomberg U.S. Aggregate Bond Index returned +1.64% (the benchmark’s strongest monthly return over the past year) as Treasury bond yields fell by an average of 25 basis-points, and gold gained +7.86%.
Year-to-date the S&P 500 has gained +0.67%, the S&P 500 Equal-Weighted Index has returned +7.05%, and the Bloomberg U.S. Aggregate Bond Index is up +1.75%.
Sector returns in February
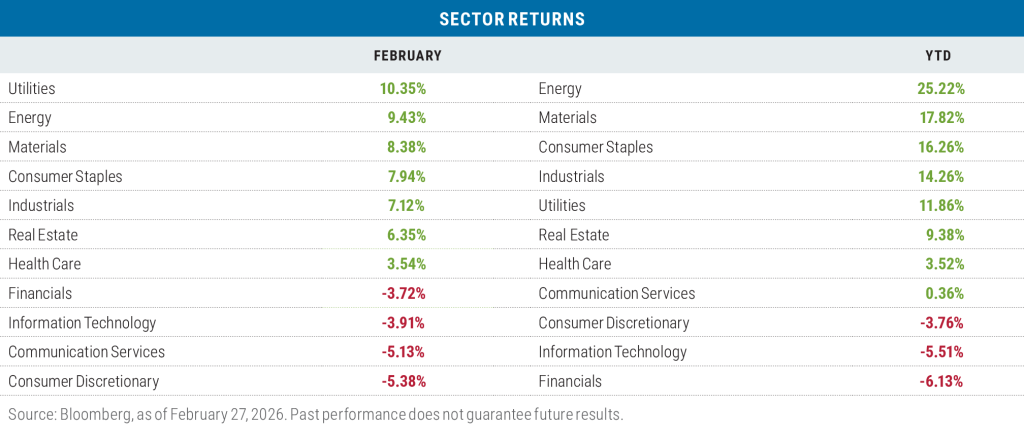
Seven of the eleven sectors that comprise the S&P 500 produced gains in February, led by a combination of defensive sectors (Utilities, Consumer Staples) and cyclical sectors (Energy, Materials, Industrials). Sectors with heavy exposure to “Big Tech” (Consumer Discretionary, Communication Services, Information Technology) proved to be laggards during the month. The “Magnificent 7,” which reside in those lagging sectors, fell by -7.28% while the “S&P 493” gained 2.00%.
It has been much the same on a year-to-date basis for sector returns, with cyclicals and defensives leading, while sectors exposed to Big Tech have lagged. The Financials sector, while considered to be a cyclical, has suffered due to the belief that the sector has perhaps the greatest exposure to potential A.I. disruption.
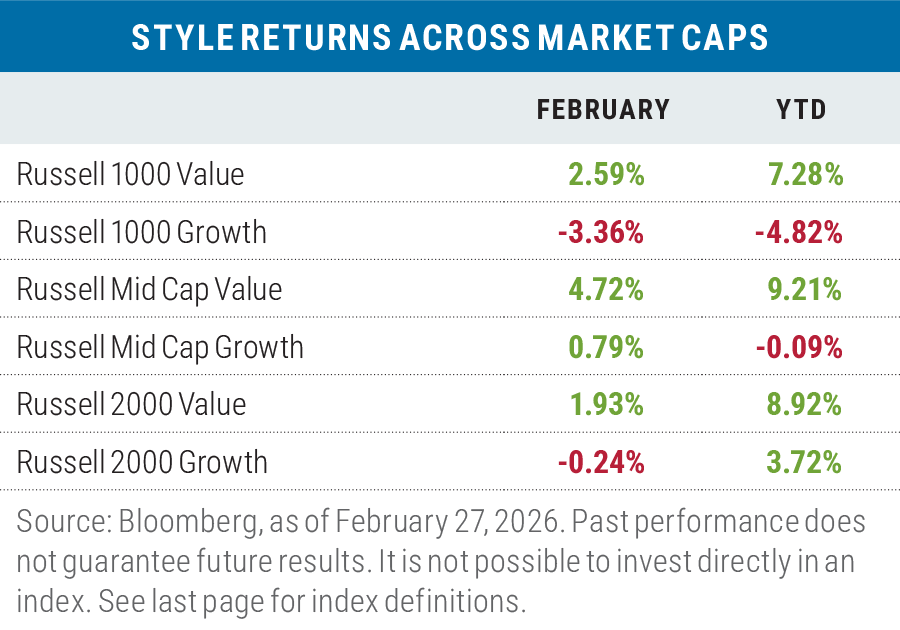
Value continues its lead in February
For a fourth consecutive month Value outperformed Growth by an average of 4.02% when measured across the three capitalization ranges of the listed Russell benchmarks. It was the best four-month period for Value versus Growth since April 2002 on a combined basis.
The Technology sector was once again responsible for the bulk of the large-cap value outperformance during February, landing in positive territory with a gain of 0.60% in the value benchmark versus a loss of -4.89% for the Tech sector in the Russell 1000 Growth Index.
Tech comprises 11.05% of the Russell 1000 Value Index but an astonishing 48.84% of the Russell 1000 Growth Index. The Russell 1000 Value Index benefited by not holding two stocks during the month— Microsoft (-8.52%) and NVIDIA (-7.29%)—which were responsible for 82% of the Tech sector underperformance in the Russell 1000 Growth Index.
The Technology sector also led to performance disparities in the mid-cap space where the Tech sector in the Russell Mid-Cap Value Index had a return of 11.43% for the month versus a loss of -4.70% for the sector in the Russell Mid-Cap
Growth Index.
In small caps, the Russell 2000 Value Index was helped by a 8.7% exposure to Energy which gained 12.94%, while the Russell 2000 Growth Index was hurt by a 24.0% exposure to Health Care that dropped by -2.30% during the month.
Year-to-date, Value has outperformed Growth by an average of +8.87% across the three capitalization ranges of the Russell benchmarks, with the largest contribution coming from the Russell 1000 Value index, which is now ahead of the Russell 1000 Growth Index by +12.10%—the best two-month relative performance for large-cap Value versus large-cap Growth since March 2001. The Technology sector is responsible for 30% of the Russell 1000 Value Index outperformance with a gain of 9.04% versus a loss of -4.46% for Tech in the Russell 1000 Growth Index over the two-month period.
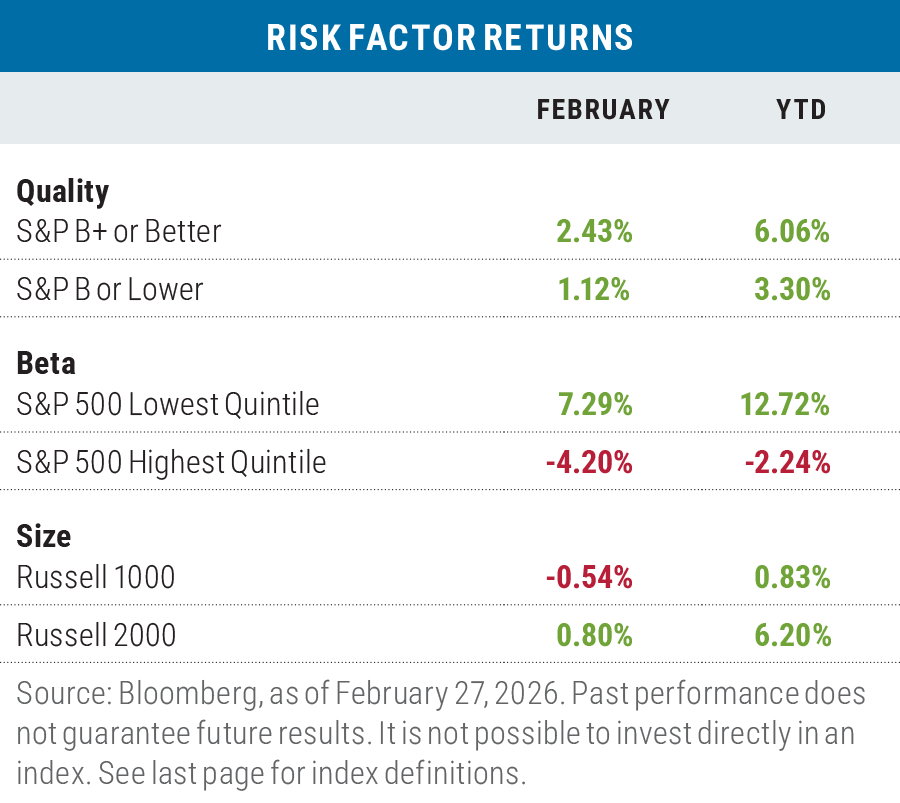
More “risk-off” than “risk-on” in February
In February, the risk-off characteristics of high quality and low beta outperformed, whereas the risk-on characteristic of
small-size beat the risk-off large-size factor as measured by the Russell 2000 Index versus the Russell 1000 Index, an
indication of investors rotating exposures. Within the Russell 1000 Index, the smallest capitalization quintile returned
0.48% while the largest capitalization quintile fell by -1.34% as that quintile has the greatest exposure to mega-tech
stocks.
Year-to-date was much the same in terms of risk returns, and once again, within the Russell 1000 Index the smallest
capitalization quintile returned 3.38% to a loss of -0.25% for the largest capitalization quintile.
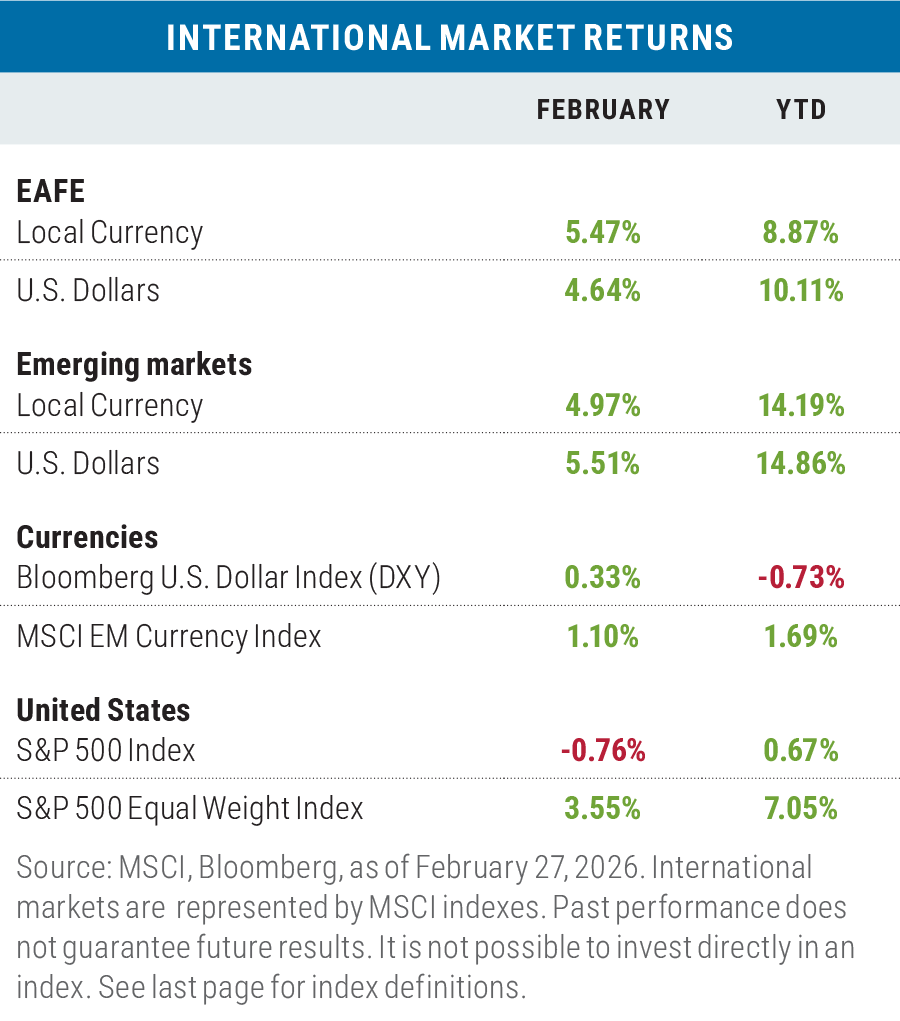
International stocks shine
Developed-market stocks (EAFE) outperformed the S&P 500 in dramatic fashion in February, leading to the best relative performance versus the capitalization-weighted S&P 500 since December 2022. Japanese stocks were the front
runners as the MSCI Japan Index gained 8.59% $USD, while the returns in France, Switzerland and the United Kingdom all exceeded 5%. Emerging-market stocks followed suit, particularly when measured in local currency terms, led by South Korea (+22.02% $USD) and Taiwan (+12.75% $USD) on strength in semiconductor companies like Samsung (+32.24% $USD) and Taiwan Semiconductor (+13.32% $USD).
On a year-to-date basis, it was the best relative two-month
performance for EAFE versus the S&P 500 since last April,
and for the MSCI EM Index, the best relative two-month
performance since May 2009.
Looking ahead
With the Supreme Court striking down President Trump’s use of the IEEPA rule to administer tariffs, the White House immediately dusted off Section 122 of the Trade Act of 1974 as a work-around. That provision lets a President impose tariffs of up to 15% across the board for up to 150 days “to deal with large and serious United States balance-of-payments deficits.” President Trump started with a 10% across the board tariff for all countries on February 20th, but one day later increased that to 15%, pushing the effective U.S. tariff to upwards of 12% considering actual trade composition and product carveouts.
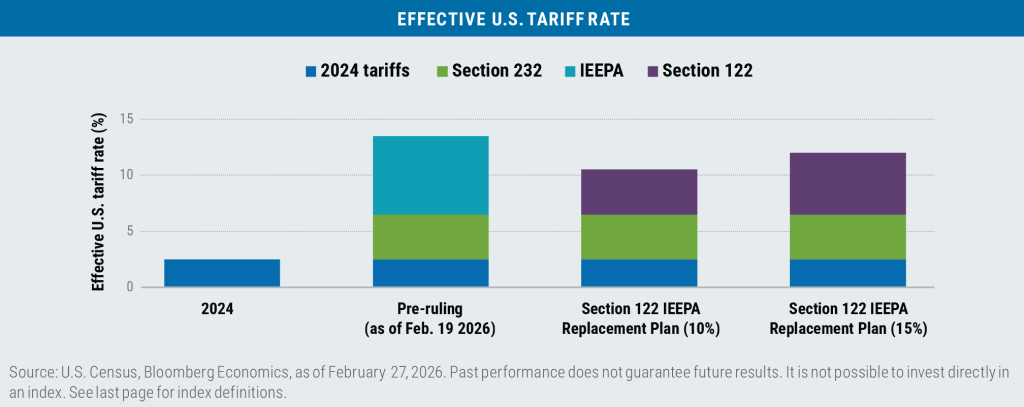
The Section 122 tariff authority could act as a stopgap measure while the administration readies more permanent tariffs under Section 301 of the Trade Act, which Trump used in his first term for tariffs on China.
Additionally, Trump could expand other tariffs that he has already imposed in his first and second terms, like the sector- specific tariffs on steel, aluminum, cars, trucks and/or lumber.
As the tariffs levied under IEEPA have now been deemed illegal, there are a plethora of companies that have lined up to
re-claim what has been collected.
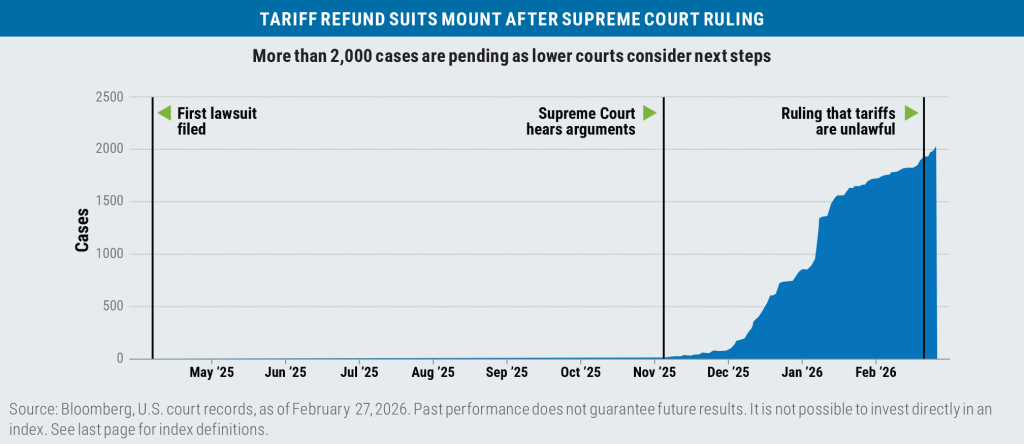
The Trump administration had said in multiple court cases regarding tariffs that it will reliquidate, meaning correct or reevaluate, any tariffs that have already been paid and finalized if the IEEPA tariffs were declared unlawful and a court orders them to do so.
More recently, Trump has suggested his administration might oppose refunds, or at least not make the process easy for the importers that have paid tariffs in the past 10-months.
It could take years of litigation to determine what happens to the more than $170 billion in tariffs collected under the now-invalid policy, though Morgan Stanley has estimated that if a refund of 80% of the tariffs were fast-tracked, it could lead to 0.17% bump to GDP this year.
While questions (and doubts) regarding the cost/benefit of the ongoing A.I. buildout and rate of adoption have been percolating for a few years, a report issued by Citrini Research on February 22nd titled “The 2028 Global Intelligence Crisis” threw another curveball at the debate. The report hypothesized a worst-case scenario of an A.I.-driven economic downturn where aggressive A.I. adoption promotes aggressive cost-cutting, triggering massive white-collar layoffs that collapses consumer spending and leads to a broad-based stock market sell-off.
A so-called rebuttal to the report titled “The 2028 Global Intelligence Boom” was also released on February 22nd by Quiet Capital’s Michael X. Bloch that presented an almost polar opposite conclusion, framing artificial intelligence as a major deflationary force that drives productivity gains and economic growth, and a transitioning segment of the workforce rather than one that is obsolete.
Academic studies on A.I.’s potential effect on productivity vary widely
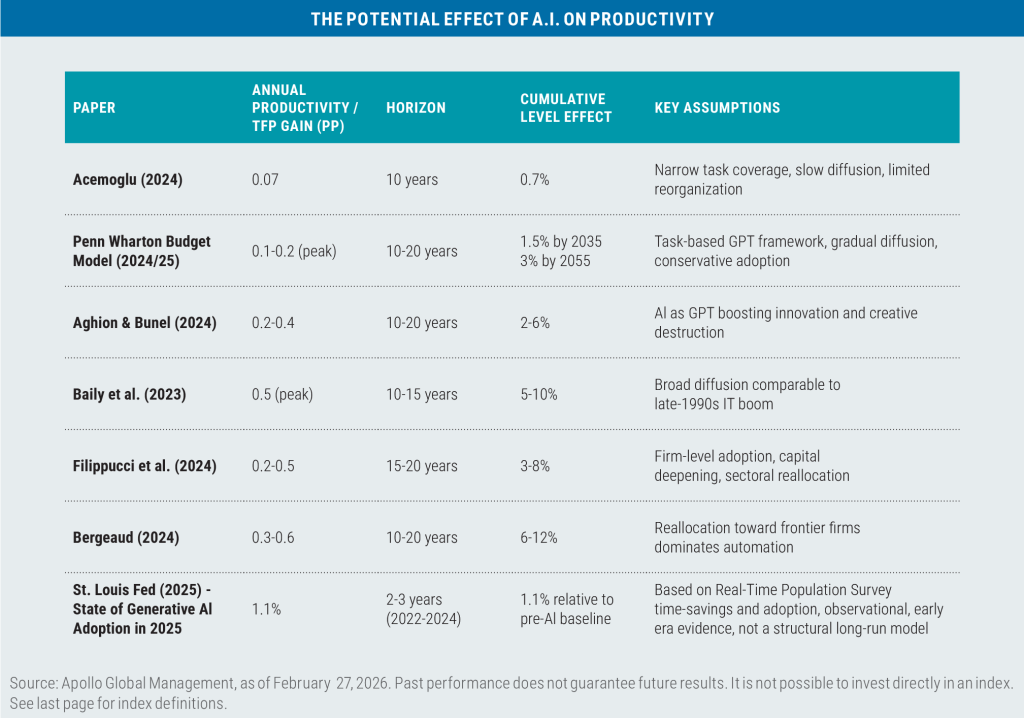
At Boston Partners, our perspective on A.I.’s likely impact on organizational processes is that it will be more complementary than revolutionary.
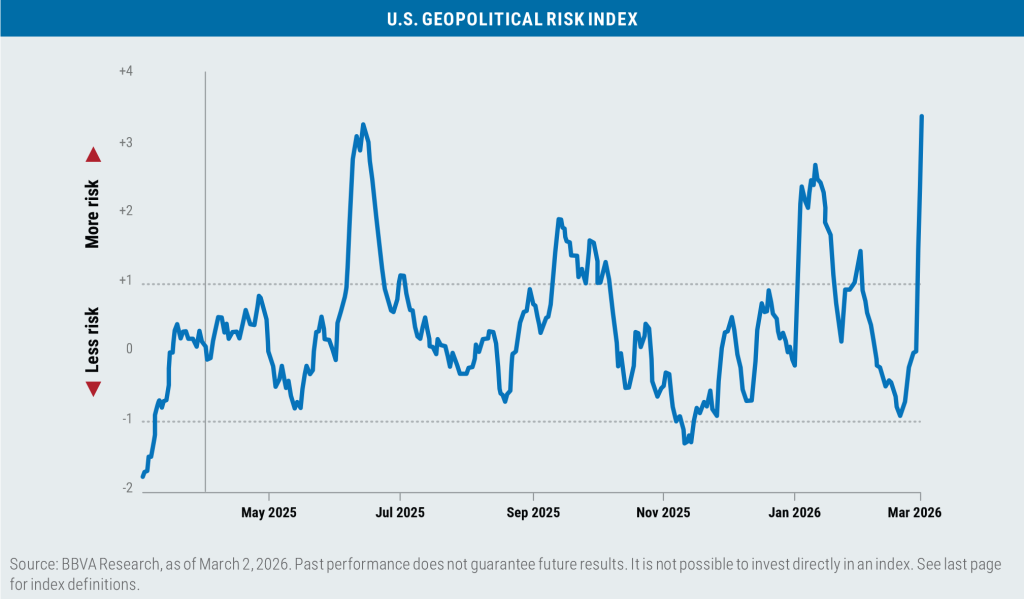
Lastly, the so-called “War in Iran” (so-called as only Congress can declare a U.S. war) is now (using Donald Rumsfeld parlance) a “known, unknown” in terms of scope and length. While President Trump initially indicated that the war would most likely be relatively short in duration (“It could take four weeks or less.”), he has recently stated that the U.S. military has the “capability to go far longer than that.”
The ongoing uncertainty surrounding the confl ict also includes:
- If there is a new political regime in Iran, who will lead it?
- Will “boots on the ground” be needed to achieve the U.S. goals for the operation?
All of which has led to a spike in geopolitical risk for the United States.
While the current global state of affairs is unsettling, history tells us that events such as those being experienced now
have not necessarily led to a collapse in stock prices.
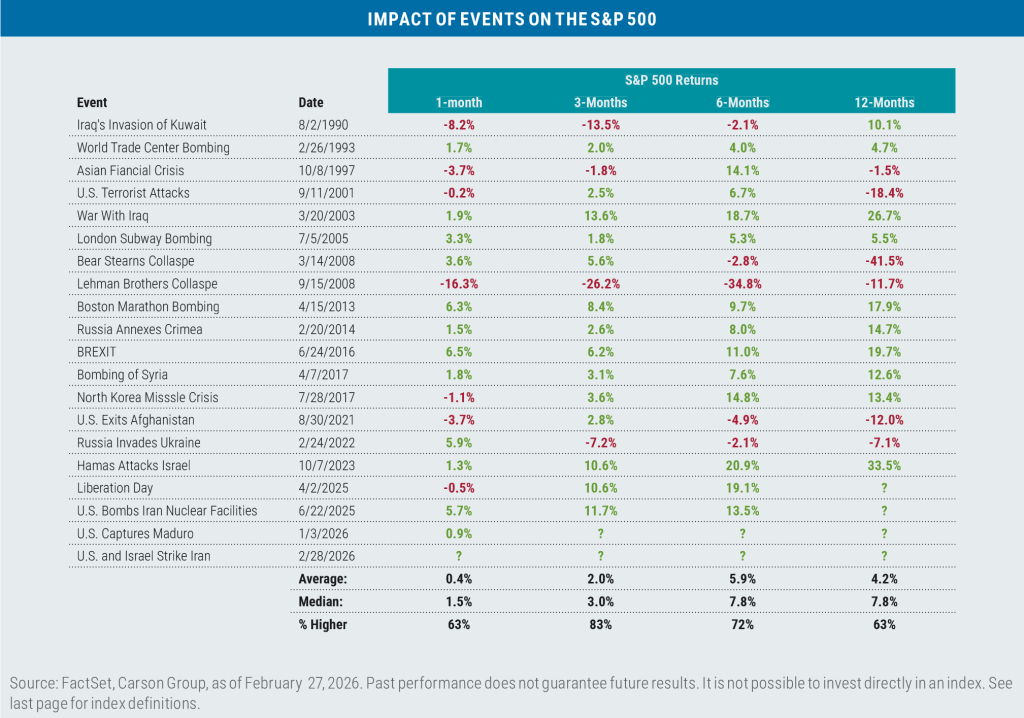
And while volatility has increased (VIX Index @ 23.6) and price/earnings multiples have contracted, there are several indicators that should placate nervous investors:
- Little risk of recession
- Stable interest rates
- Tight credit spreads, and
- 2026 Expected S&P 500 EPS growth at 14.4% (last week 14.5%)
All in all, the recent 1.86% drawdown in the S&P 500 seems more garden variety in nature and not something to be overly concerned about at this juncture.

Boston Partners Global Investors, Inc. (“Boston Partners”) is an investment adviser registered with the SEC under the Investment Advisers Act of 1940. The views expressed in this commentary reflect those of the author as of the date of this commentary. Any such views are subject to change at any time based on market and other conditions and Boston Partners disclaims any responsibility to update such views. Past performance is not an indication of future results.
Discussions of securities, market returns, and trends are not intended to be a forecast of future events or returns. You should not assume that investments in the securities identified and discussed were or will be profitable.
Important information
Beta is a measure of a portfolio’s market risk relative to its benchmark. In general, a beta higher than 1.00 indicates a more volatile portfolio and beta lower than 1.00 indicates a less volatile portfolio in relation to its benchmark. Big Tech refers to the largest six tech companies in the U.S.: Alphabet, Amazon, Apple, Meta Platforms, Microsoft and Nvidia. The CBOE Volatility Index (VIX) is a forward looking measure of expected volatility of the S&P 500 Index using the calucated midpoint of option bid/ask quotes. International Emergency Economic Powers Act (IEEPA) is a federal law authorizing the president to regulate international commerce after declaring a national emergency. Section 122 of the Trade Act of 1974 allows the president to impose temporary import surcharges.(e.g. tariffs), not exceeding 15 percent for a maximum of 150 days to address fundamental international payments problems, including large balance-of-payments deficits or imminent dollar depreciation. Section 301 of the Trade Act of 1974, Congress grants the Office of the United States Trade Representative (USTR) a range of responsibilities and authorities to investi-gate and take action (e.g., impose a tariff) to enforce U.S. rights under trade agreements and respond to certain foreign trade practices. Section 232 of the Trade Expansion Act of 1962 authorizes the U.S. President to impose restrictions, such as tariffs, on foreign imports if the Department of Commerce determines they threaten national security. TFP Gain or total factor productivity is the portion of output growth driven by efficiency improve-ments, technological advancements and innovation. The lowest and highest quintile represents the bottom 20% an the top 20%, respectively. The U.S. Geopolitical Risk Index was originally constructed by BBVA Research based on the tone and coverage associated with the GDELT search of the intersection of two sets of keywords, according to the methodology of Caldara, Dario and Matteo Iacoviello (2022). This index is a weighted product made of the tone (i.e. associated sentiment) and relative coverage (i.e. number of news that match the two sets of keywords/total number of published news) from GDELT. The indices are constructed using daily data and then smoothed by converting them into a 28-day moving average to reduce noise and enhance the accuracy of the indices. The GDELT Project, or Global Database of Events, Language, and Tone, is an initiative to construct a catalog of human societal-scale behavior and beliefs across all countries of the world, connecting every person, organization, location, count, theme, news source, and event across the planet into a single massive network that captures what’s happening around the world, what its context is and who’s involved, and how the world is feeling about it, every single day. The Caldara and Iacoviello Geopolitical Risk (GPR) Index tracks the number of articles related to adverse geopolitical events in ten newspapers each month (as a share of the total number of news articles). The results are organized into eight categories: War Threats (Category 1), Peace Threats (Category 2), Military Buildups (Category 3), Nuclear Threats (Category 4), Terror Threats (Category 5), Beginning of War (Category 6), Escalation of War (Category 7), and Terror Acts (Category 8). The Geopolitical Threats (GPRT) Index includes words belonging to categories 1 to 5 above; the Geopolitical Acts (GPRA) Index includes words belonging to categories 6 to 8.
Index definitions
The Bloomberg U.S. Aggregate Bond Index tracks the performance of intermediate-term investment-grade bonds traded in the United States. The Bloomberg U.S. Dollar Index (DXY) is used to measure the value of the dollar against a basket of six foreign currencies. The value of the index is a fair indication of the dollar’s value in global markets. The Magnificent Seven stocks are a group of high-performing and influential companies in the U.S. stock market: Alphabet, Amazon, Apple, Meta Platforms, Microsoft, Nvidia, and Tesla. The MSCI Emerging Markets (EM) Currency Index tracks the performance of emerging market currencies relative to the U.S. dollar where the weight of each currency is equal to its country weight in the MSCI Emerging Markets Index. The MSCI EAFE Index tracks the performance of large- and mid-cap equities traded across global developed markets, excluding the United States and Canada. The MSCI Emerging Markets Index tracks the performance of large- and mid-cap equities traded in global emerging markets. The MSCI Japan Index is designed to measure the performance of the large and mid cap segments of the Japanese market. The Russell 1000 Index tracks the performance of the 1,000 largest companies traded in the United States. The Russell 2000 Index tracks the performance of the 2,000 smallest companies traded in the United States. The Russell 1000 Growth and Value Indexes track the performance of those large-cap U.S. equities in the Russell 1000 Index with growth and value style characteristics, respectively. The Russell 2000 Growth and Value Indexes track the performance of those small-cap U.S. equities in the Russell 2000 Index with growth and value style characteristics, respectively. The Russell Midcap Growth and Value Indexes track the performance of those mid-cap U.S. companies in the Russell 1000 Index with growth and value style characteristics, respectively. The S&P 500 Index tracks the performance of the 500 largest companies traded in the United States. The S&P 500 Equal Weight Index also tracks the performance of the 500 largest companies traded in the United States, but weights each company equally, rather than proportionally according to market cap. The S&P 493 is not an official index, but reflects the performance of the S&P 500 excluding the Magnificent Seven. S&P credit ratings, which range from AAA (highest) to D (default), are assigned by S&P Global to individual companies to indicate their relative creditworthiness. It is not possible to invest directly in an index.
Market capitalization breakpoints
The breakpoints for capitalization ranges should be viewed only as guideposts and will change over time. In general, FTSE Russell (which maintains a number of stock-market indexes based on company size) considers small-cap stocks to have market caps of between $150 million and $7 billion, mid caps to have market caps between $7 billion and $150 billion, and large caps to be those companies with market caps above $150 billion.
Boston Partners Global Investors, Inc. (Boston Partners) is composed of three divisions, Boston Partners, Boston Partners Private Wealth, and Weiss, Peck & Greer (WPG) Partners, and is an indirect, wholly owned subsidiary of ORIX Corporation of Japan (ORIX).
8810003.1